D3js raster tools docs
This small documentation explains how to work with raster data and the d3js to create dynamic data visualizations.
Usually, the examples show how to place points or polygons on a map. Those examples are working with vectorial data. But many datasets are rasters, so the lack of examples and libraries made difficult to use d3js with meteorological data, DEM data, etc.
Some common representations could be easily done with existing libraries, others didn’t have available tools. This tutorial will show how to use:
- geotiff: Reading the GeoTIFF data (not the projectiopn, which would be cool)
- raster-streamlines: Drawing streamlines from vectorial fields
- raster-marching-squares: Creating the isobands with the wind speed
- reproject: Reprojecting the generated GeoJSON
- proj4js: Reprojecting points
And examples for all the common raster visualizations covered by the Basemap library. All the examples have the Canvas and the SVG version so it’s easy to use the most convenient.
I would really appreciate all the feedback. Disqus comments are available on each page.
Section Examples list
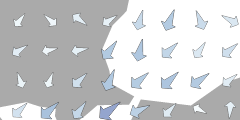 Wind arrows Wind arrows |
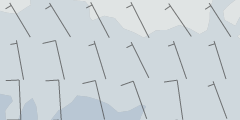
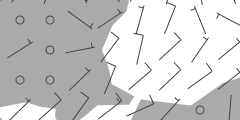 Wind barbs Wind barbs |
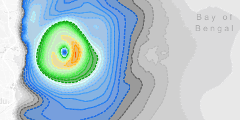
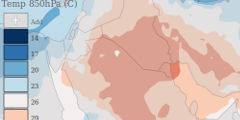
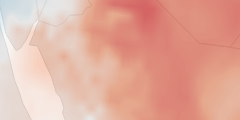 Raster interpolation Raster interpolation |
|
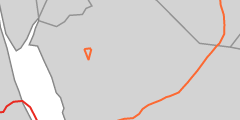 Isolines Isolines |
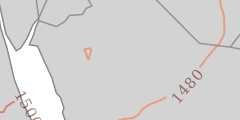 Isolines with labels Isolines with labels |
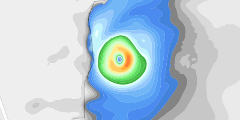
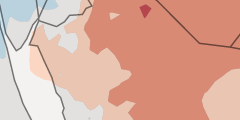 Isobands Isobands |
 Streamlines Streamlines |
 Projected GeoTIFF Projected GeoTIFF |
 Projected raster interpolation Projected raster interpolation |
 Leaflet Leaflet |
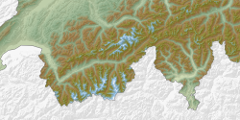 Shaded relief Shaded relief |
Other visualization examples
 Layer selection Layer selection |
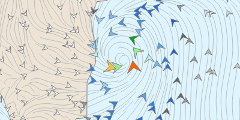 Animated streamlines Animated streamlines |
 Color scale isobands Color scale isobands |
 Color scale shaded relief Color scale shaded relief |