Exercice maps with python
I use a bike to commute in Barcelona since my teenage years. I recently bought a speedometer that has a GPS to store the tracks. So I opened Strava and saw a cool heatmap with the most frequently used routes and an option to see mine… that was behind a paywall. So instead of paying for it (the wise solution) I decided to code my own convoluted solution.

I decided to use a python script and output a png image, because my idea is creating a map for each month and put it in my Obsidian vault.
Table of Contents
Downloading the data
I am using Strava, the most popular service for storing exercise data, because it’s where my GPS device exports. Strava offers two ways to export bulk data, an API and a bulk export from the settings. I used both but the bulk export doesn’t work sometimes, so my favourite method is API.
Getting the API keys
To run the script, you will need the API keys, which is what makes this method more complicated. Strava provides a step by step tutorial here. Essentially, you have to create an application with the proper permissions and you will be given the data. The permissions you need to give are:
- profile:read_all
- activity:read
- activity:read_all
Code
# ==== CONFIG ====
CLIENT_ID = "your_client_id"
CLIENT_SECRET = "your_client_secret"
TOKENS_FILE = "tokens.json"
SAVE_DIR = "strava_gpx"
PER_PAGE = 100

def load_tokens():
    if os.path.exists(TOKENS_FILE):
        with open(TOKENS_FILE, "r") as f:
            return json.load(f)
    return {"refresh_token": None, "access_token": None, "expires_at": 0}

def save_tokens(tokens):
    with open(TOKENS_FILE, "w") as f:
        json.dump(tokens, f, indent=2)

def get_access_token():
    tokens = load_tokens()
    refresh_token = tokens.get("refresh_token")
    if not refresh_token:
        raise RuntimeError("No refresh_token found. Run OAuth flow to get one first.")

    url = "https://www.strava.com/oauth/token"
    payload = {
        "client_id": CLIENT_ID,
        "client_secret": CLIENT_SECRET,
        "refresh_token": refresh_token,
        "grant_type": "refresh_token"
    }
    res = requests.post(url, data=payload)
    res.raise_for_status()
    new_tokens = res.json()

    # Update tokens.json with new refresh + access token
    save_tokens(new_tokens)
    return new_tokens["access_token"]

def get_all_activities(access_token):
    headers = {"Authorization": f"Bearer {access_token}"}
    activities = []
    page = 1
    while True:
        url = f"https://www.strava.com/api/v3/athlete/activities"
        params = {"per_page": PER_PAGE, "page": page}
        res = requests.get(url, headers=headers, params=params)
        res.raise_for_status()
        data = res.json()
        if not data:
            break
        activities.extend(data)
        page += 1
    return activities

token = get_access_token()
activities = get_all_activities(token)- The refresh token is stored in a file, so every time is called, a new one will be stored if needed
- The token file tokens.json has to be initialized like:
{
  "refresh_token": "your_first_refresh_token"
}- get_access_token is the function that calls the endpoint to get the new access token, that changes with time
- In get_all_activities it’s possible to see how to use the token in the header. The endpoint returns all the activities with some metadata. The real path is in another endpoint, though
To get one of the activities data and convert it into a pandas dataframe, we create two more functions:
def get_streams(access_token, activity_id):
    url = f"https://www.strava.com/api/v3/activities/{activity_id}/streams"
    params = {"keys": "time,latlng,altitude", "key_by_type": "true"}
    headers = {"Authorization": f"Bearer {access_token}"}
    res = requests.get(url, headers=headers, params=params)
    if res.status_code == 200:
        return res.json()
    return None


def stream_to_df(streams):
    time1 = np.array(streams.get("time", {}).get("data", []))
    latlng = streams.get("latlng", {}).get("data", [])
    lat = [pt[0] for pt in latlng]
    lon = [pt[1] for pt in latlng]

    lon1 = np.array(lon)
    lat1 = np.array(lat)

    if len(time1) == 0 or len(lon1) == 0 or len(lat1) == 0:
        return pd.DataFrame(columns=['time', 'lon', 'lat'])

    return pd.DataFrame({'time': time1, 'lon': lon1, 'lat': lat1})
Drawing the map
I did several iterations before drawing the final map. I will put the code snippets because they explain the decisions I took
from shapely.geometry import Point
import geopandas as gpd

### From the previous example...
token = get_access_token()
activities = get_all_activities(token)

### we draw
geometry = [Point(xy) for xy in zip(df['lon'], df['lat'])]
gdf = gpd.GeoDataFrame(df, geometry=geometry, crs="EPSG:4326")
fig, ax = plt.subplots(figsize=(6, 6))
gdf.plot(ax=ax, color='blue', markersize=1)
plt.axis('equal')
plt.tight_layout()
plt.savefig("map.png", dpi=300)
plt.close()
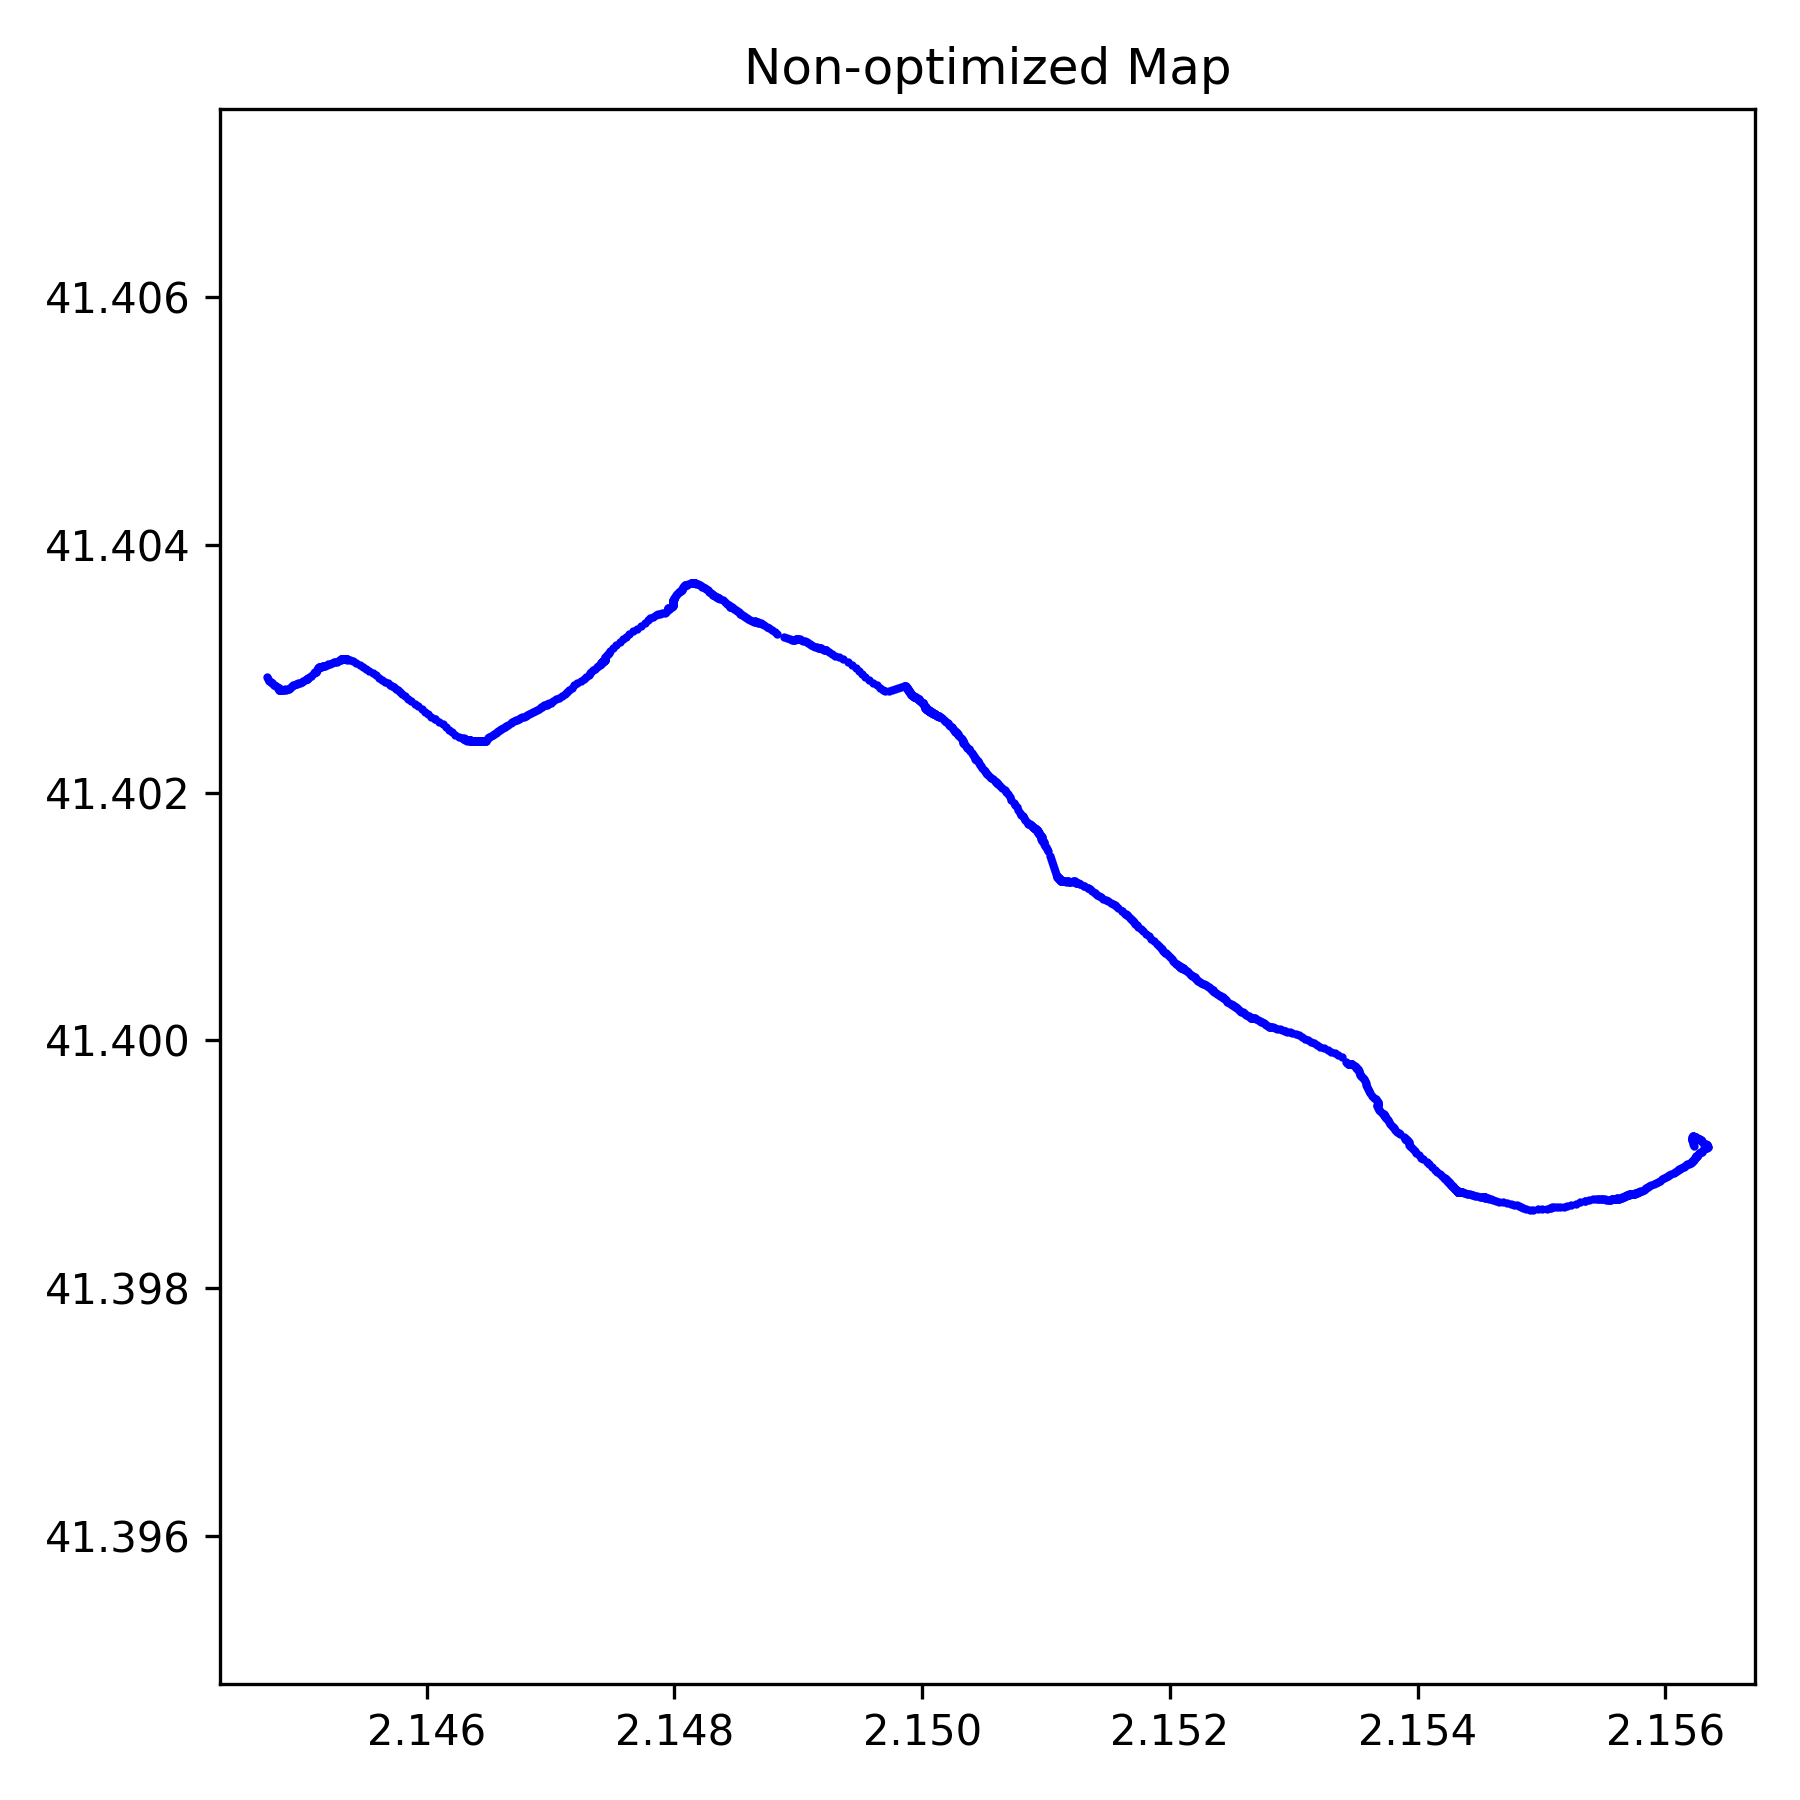
This gives the following result:

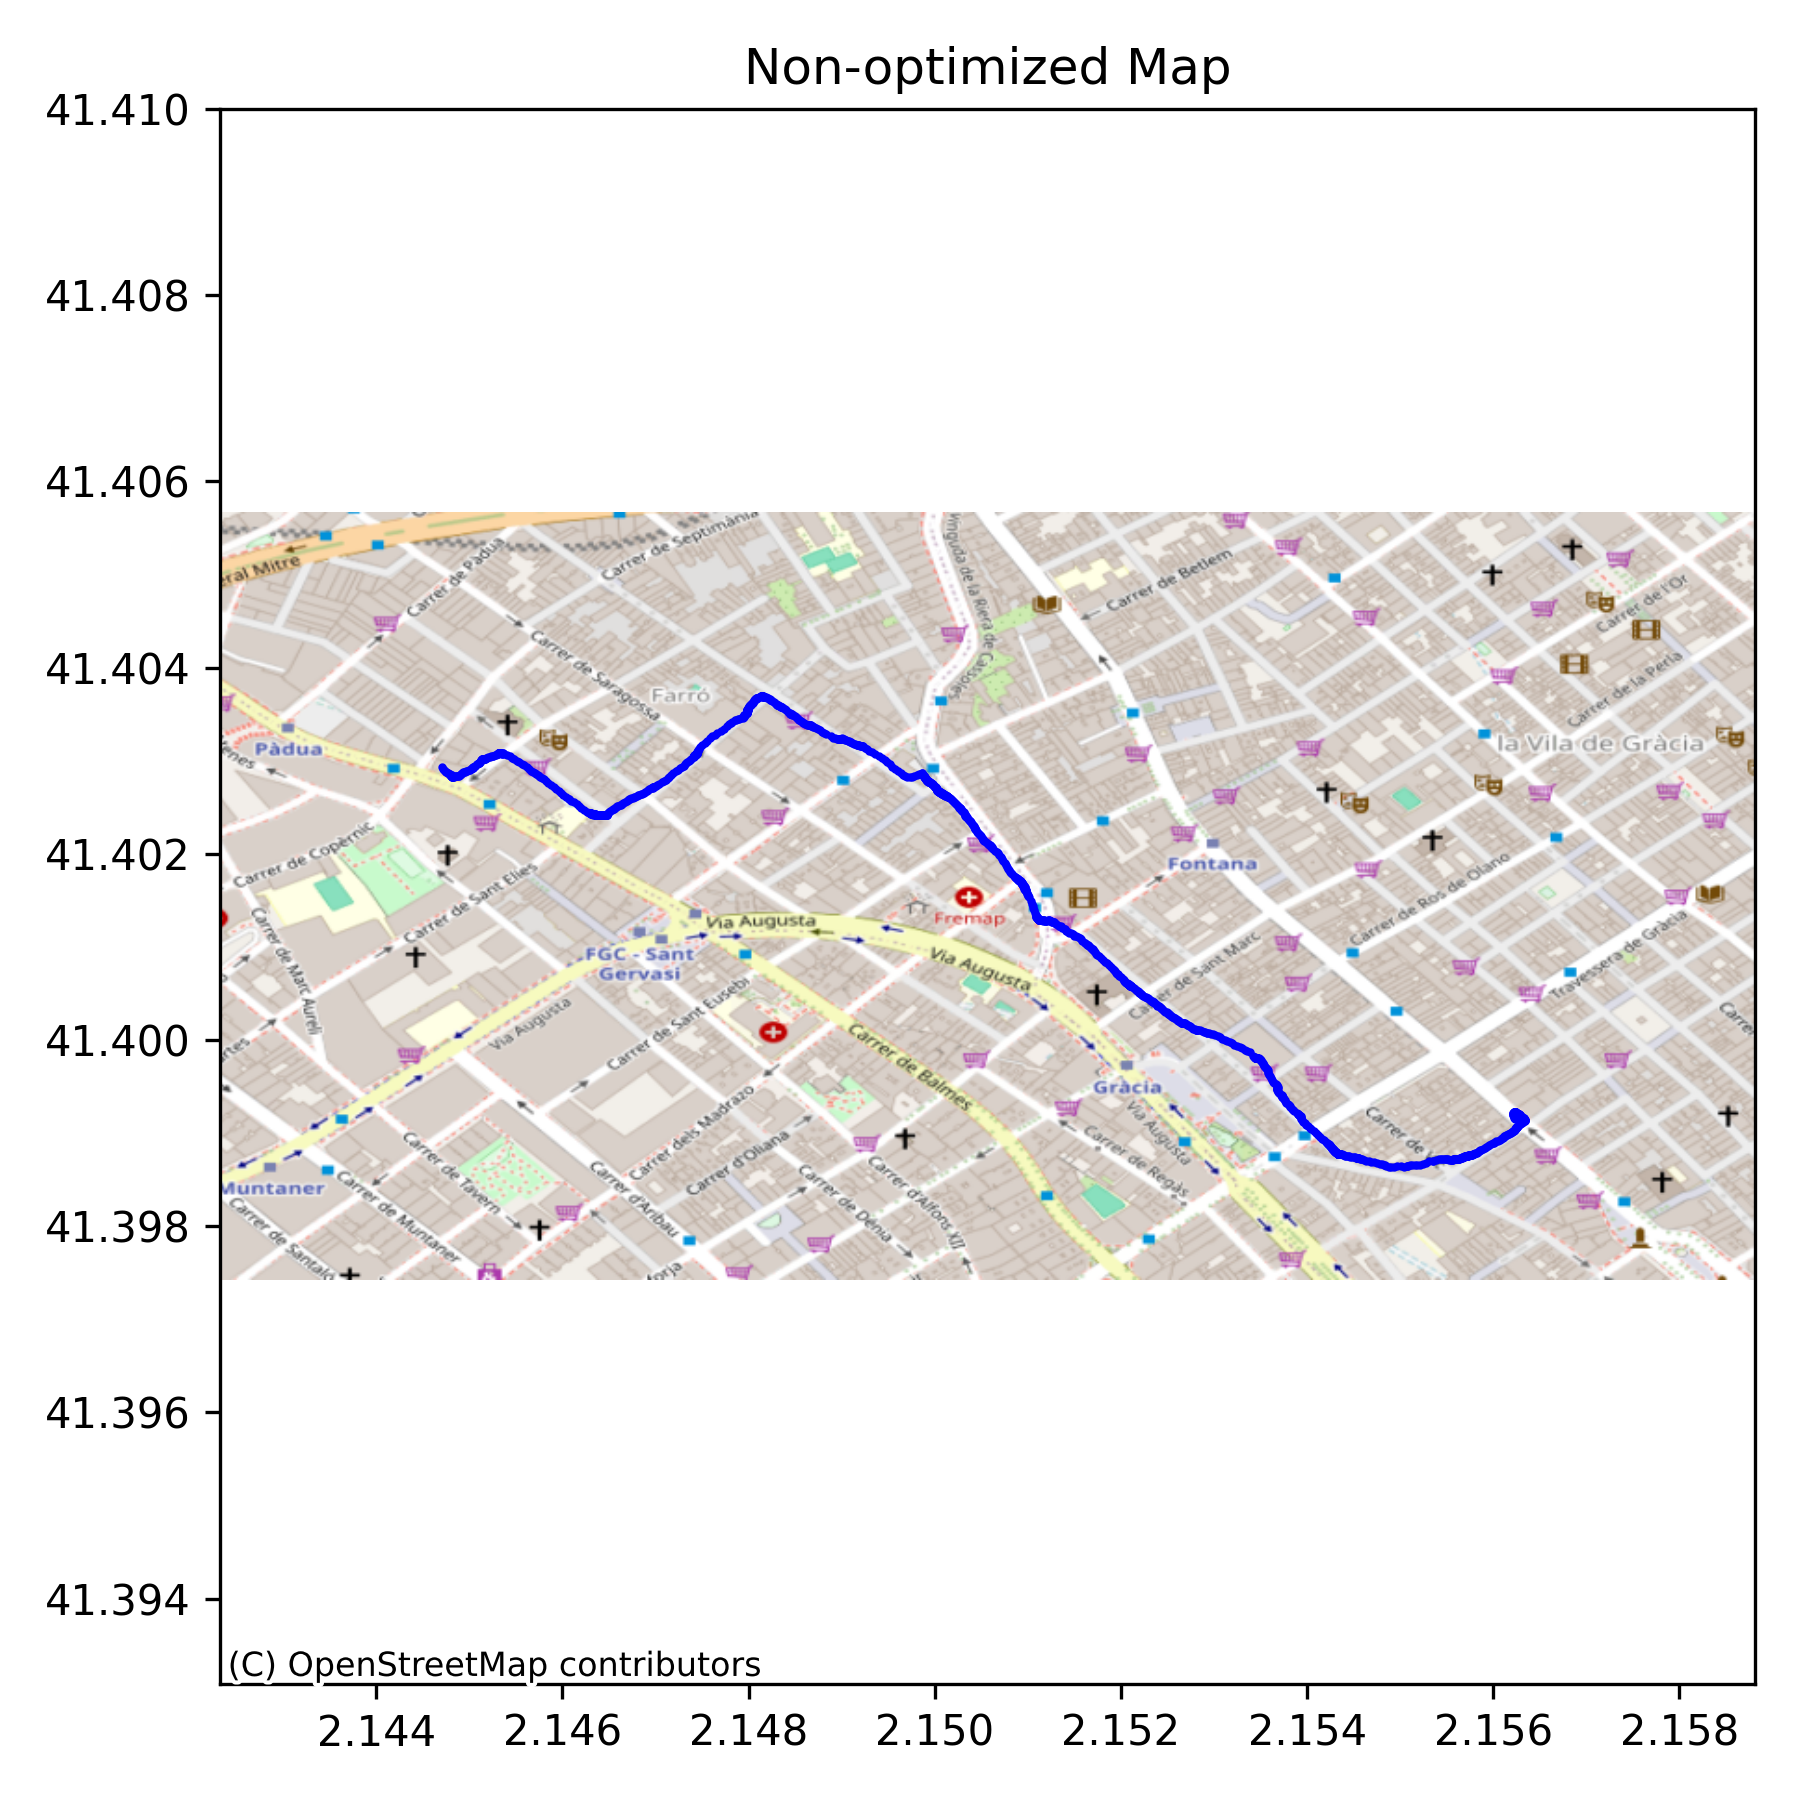
We can use the contextily library to add a basemap so we can understand if the path is correct:
import contextily as ctx

ctx.add_basemap(ax, crs=gdf.crs.to_string(), source=ctx.providers.OpenStreetMap.Mapnik)
This will give the following result:

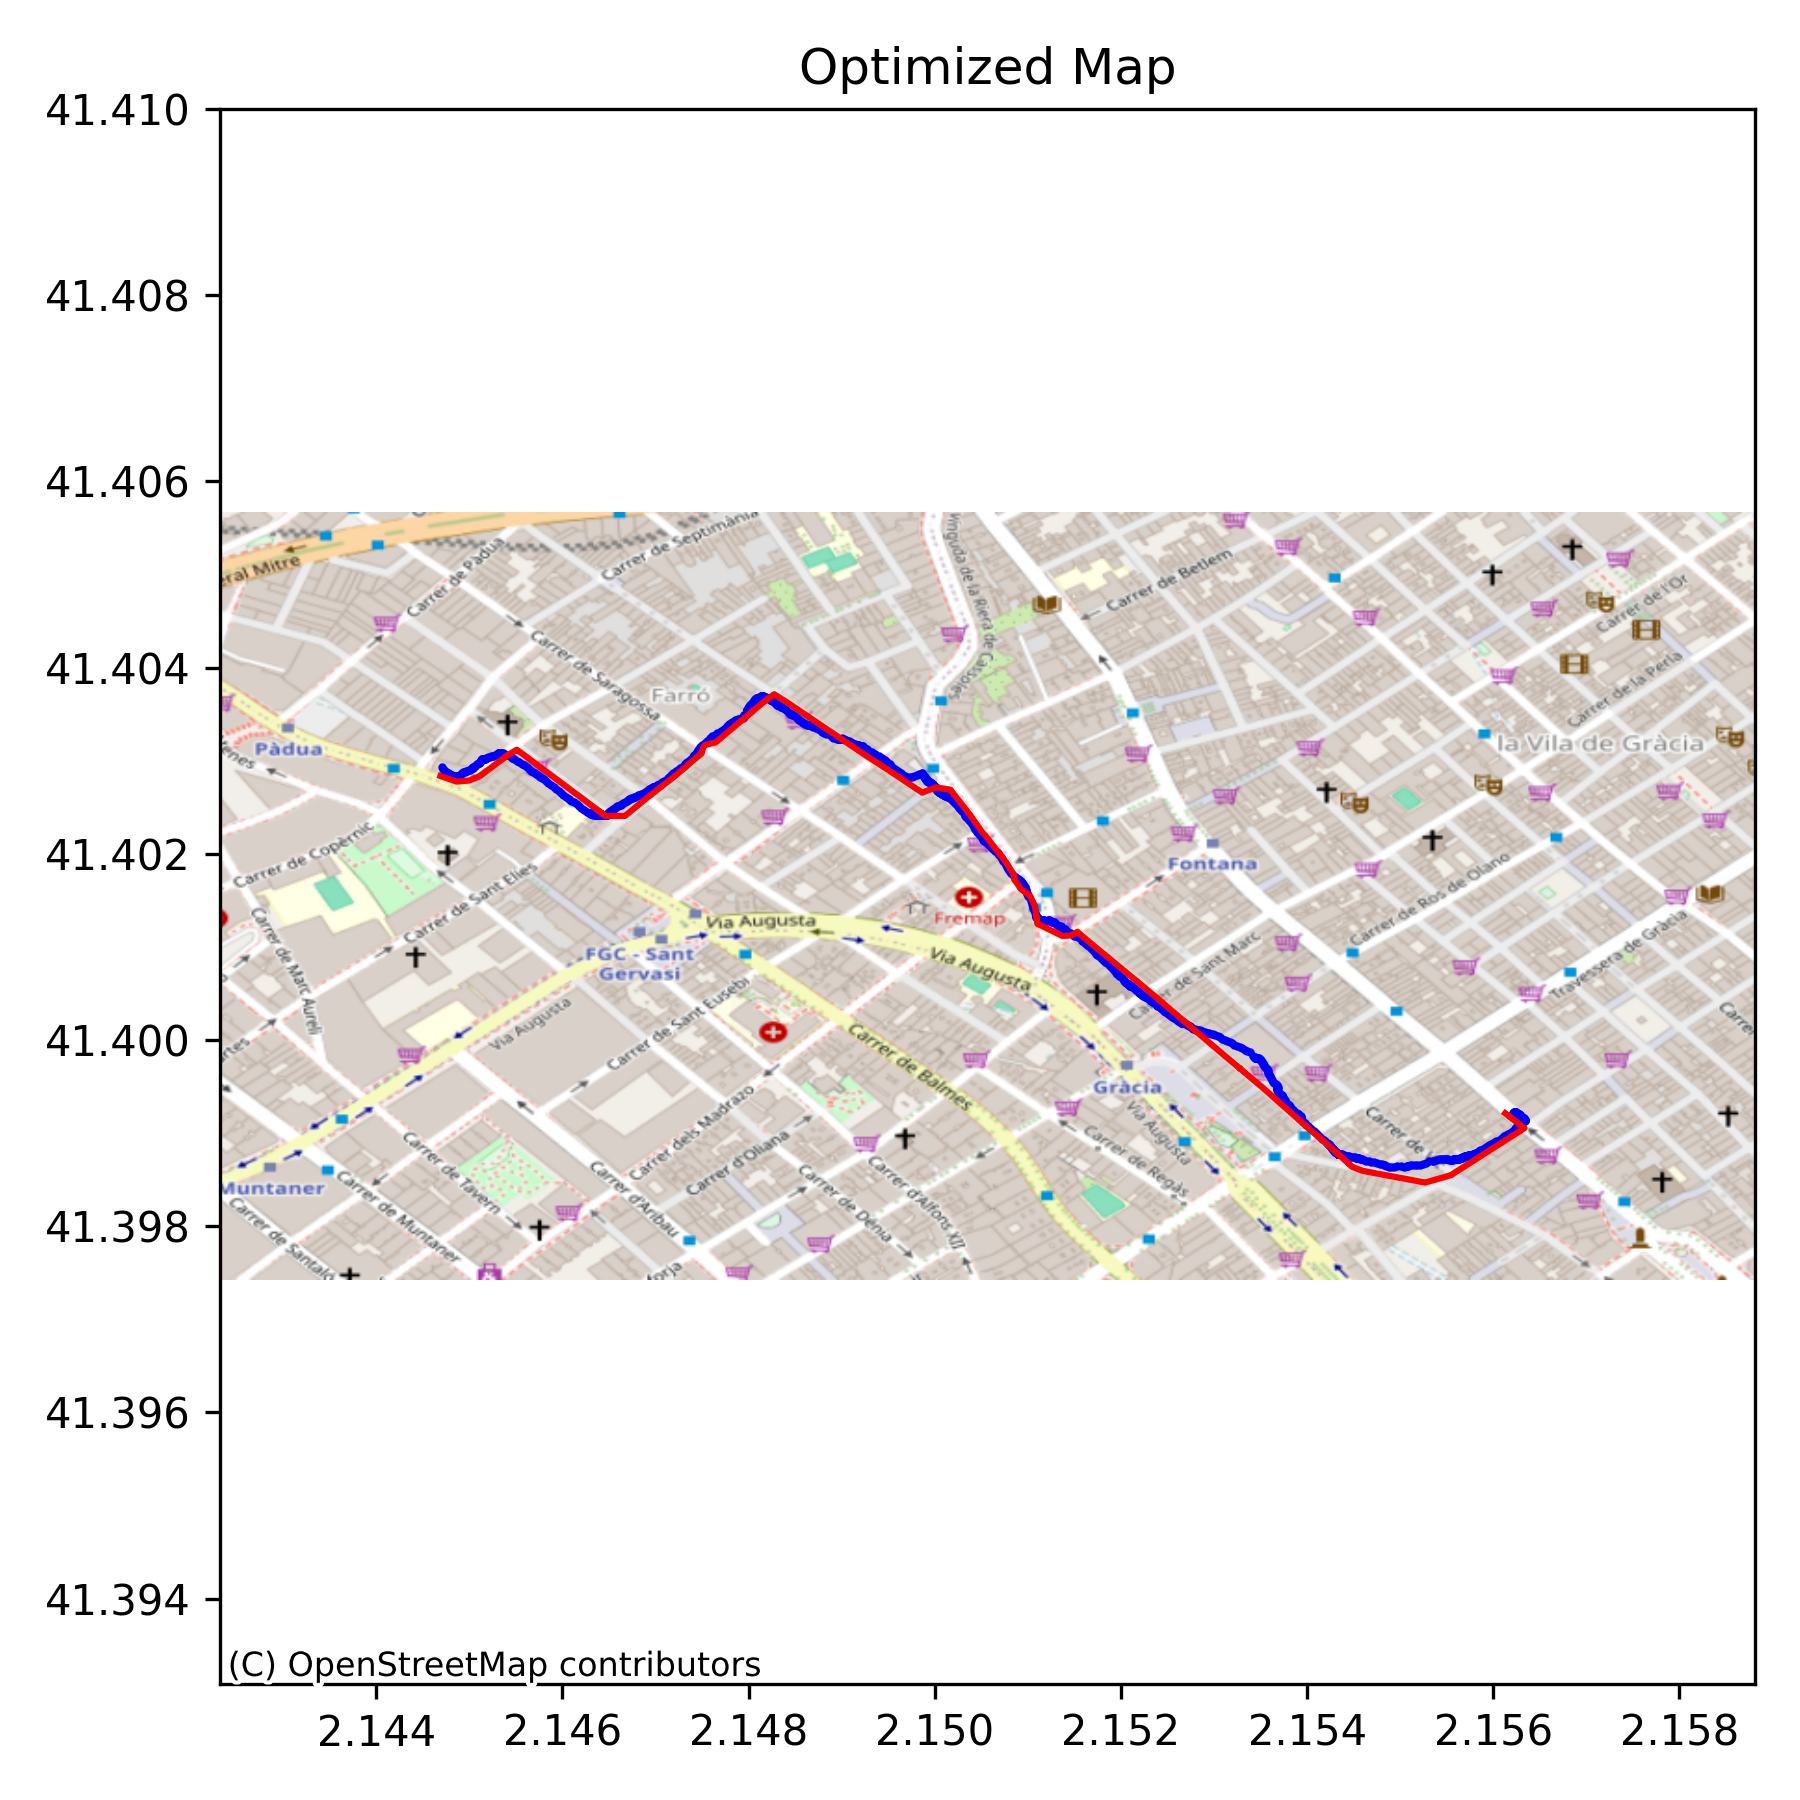
It’s easy to see that the GPS precision is not enough to properly follow the streets. The solution I thought was snapping all points to the closest street from OpenStreetMap. This is trickier than it seems, but there are libraries that help! I chose doing it in valhalla running in docker, as it was the easiest way. It’s possible installing the library, but not using pip or any easy python method. This method exposes a REST API in localhost that can then be used in any programming language.
To start the server, after installing docker, just run:
docker run -t --name valhalla_server \
    -e build_elevation=True \
    -p 8002:8002 \
    -v $PWD/routing-valhalla:/custom_files \
    ghcr.io/nilsnolde/docker-valhalla/valhalla:latest
The part of Valhalla we will use is named Meili, and it’s intended to do exactly what we want: It takes points and moves them to the closest road/path from OpenStreetMap.
The request would be:
 meili_coordinates = df.to_json(orient='records')

    meili_head = '{"shape":'
    meili_tail = ""","search_radius": 250, "shape_match":"map_snap", "costing":"pedestrian", "format":"osrm"}"""
    meili_request_body = meili_head + meili_coordinates + meili_tail

    url = "http://localhost:8002/trace_route"
    headers = {'Content-type': 'application/json'}
    data = str(meili_request_body)

r = requests.post(url, data=data, headers=headers)- We transform our dataframe with lat, lon and time to json
- We format the request, where the parameters we can touch are in meili_tail
- costing can be set to road or bike too, but it didn’t detect the streets I ride, because those are too narrow. Pedestrian seems better for dense cities like Barcelona. Search radius could be changed too
The result has to be transformed again into a dataframe to be plotted in the map
if r.status_code == 200:

    response_text = json.loads(r.text)

    resp = str(response_text['tracepoints'])

    resp = resp.replace("'waypoint_index': None", "'waypoint_index': '#'")
    resp = resp.replace("None", "{'matchings_index': '#', 'name': '', 'waypoint_index': '#', 'alternatives_count': 0, 'distance': 0, 'location': [0.0, 0.0]}")
    data = ast.literal_eval(resp)

    fixed = json.dumps(data)

    df_response = pd.read_json(StringIO(fixed))
    df_response = df_response[['name', 'distance', 'location']]

    df_trip_optimized = pd.merge(df, df_response, left_index=True, right_index=True)

    df_trip_optimized = df_trip_optimized[
        df_trip_optimized['location'].apply(lambda loc: loc != [0.0, 0.0])
    ].reset_index(drop=True)
Essentially, we transform the data from the response json and filter the points that haven’t found a road to be assigned.
We connect the points into lines to fill the possible gaps (it usually works) and convert it into a geoPandas dataframe again:
line_opt = LineString(df_trip_optimized['location'].tolist())
gdf_line_opt = gpd.GeoDataFrame(geometry=[line_opt], crs="EPSG:4326")

gdf_line_opt.plot(ax=ax, color='red', linewidth=1.2)
And this is the result, that properly follows the basemap streets:

Final script
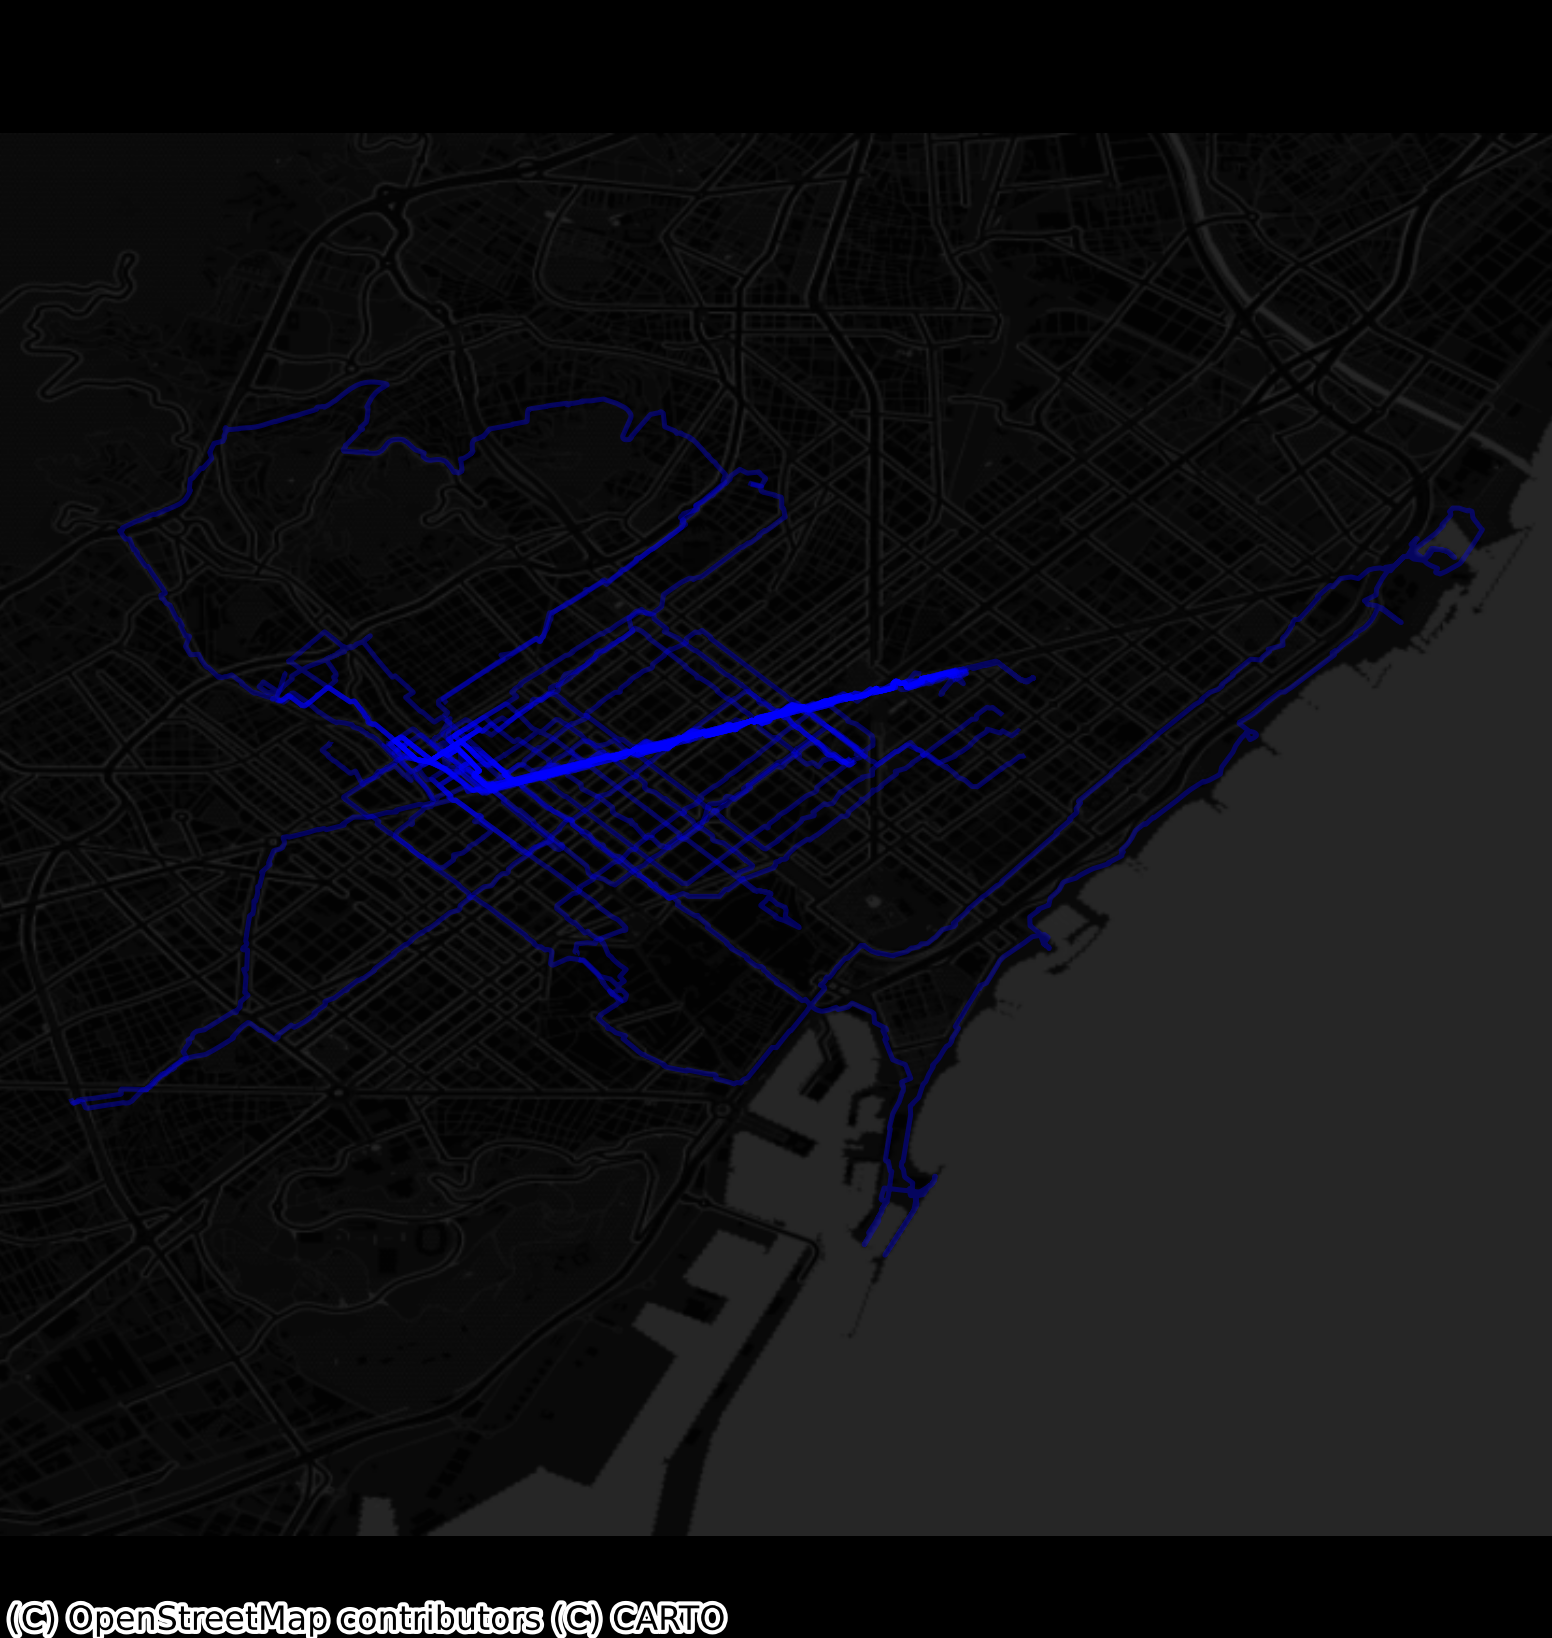
Let’s put it all together now. We will download the files, iterate all them and draw the path with an alpha value so the path gets intense if it has been done more times.
import os
import requests
from tqdm import tqdm
import json
import numpy as np
import pandas as pd
import matplotlib.pyplot as plt
from shapely.geometry import  LineString
import ast
from io import StringIO
import geopandas as gpd
import contextily as ctx


# ==== CONFIG ====
CLIENT_ID = "your_client_id"
CLIENT_SECRET = "your_client_secret"
SAVE_DIR = "strava_gpx"
PER_PAGE = 100
TOKENS_FILE = "tokens.json"

# ===============


def load_tokens():
    if os.path.exists(TOKENS_FILE):
        with open(TOKENS_FILE, "r") as f:
            return json.load(f)
    return {"refresh_token": None, "access_token": None, "expires_at": 0}

def save_tokens(tokens):
    with open(TOKENS_FILE, "w") as f:
        json.dump(tokens, f, indent=2)

def get_access_token():
    tokens = load_tokens()
    refresh_token = tokens.get("refresh_token")
    if not refresh_token:
        raise RuntimeError("No refresh_token found. Run OAuth flow to get one first.")

    url = "https://www.strava.com/oauth/token"
    payload = {
        "client_id": CLIENT_ID,
        "client_secret": CLIENT_SECRET,
        "refresh_token": refresh_token,
        "grant_type": "refresh_token"
    }
    res = requests.post(url, data=payload)
    res.raise_for_status()
    new_tokens = res.json()

    # Update tokens.json with new refresh + access token
    save_tokens(new_tokens)
    return new_tokens["access_token"]

def get_all_activities(access_token):
    headers = {"Authorization": f"Bearer {access_token}"}
    activities = []
    page = 1
    while True:
        url = f"https://www.strava.com/api/v3/athlete/activities"
        params = {"per_page": PER_PAGE, "page": page}
        res = requests.get(url, headers=headers, params=params)
        res.raise_for_status()
        data = res.json()
        if not data:
            break
        activities.extend(data)
        page += 1
    return activities


def get_streams(access_token, activity_id):
    url = f"https://www.strava.com/api/v3/activities/{activity_id}/streams"
    params = {"keys": "time,latlng,altitude", "key_by_type": "true"}
    headers = {"Authorization": f"Bearer {access_token}"}
    res = requests.get(url, headers=headers, params=params)
    if res.status_code == 200:
        return res.json()
    return None


def stream_to_df(streams):
    time1 = np.array(streams.get("time", {}).get("data", []))
    latlng = streams.get("latlng", {}).get("data", [])
    lat = [pt[0] for pt in latlng]
    lon = [pt[1] for pt in latlng]

    lon1 = np.array(lon)
    lat1 = np.array(lat)

    if len(time1) == 0 or len(lon1) == 0 or len(lat1) == 0:
        return pd.DataFrame(columns=['time', 'lon', 'lat'])

    return pd.DataFrame({'time': time1, 'lon': lon1, 'lat': lat1})

def plot_route(df, ax):
    meili_coordinates = df.to_json(orient='records')

    meili_head = '{"shape":'
    meili_tail = ""","search_radius": 250, "shape_match":"map_snap", "costing":"pedestrian", "format":"osrm"}"""
    meili_request_body = meili_head + meili_coordinates + meili_tail

    url = "http://localhost:8002/trace_route"
    headers = {'Content-type': 'application/json'}
    data = str(meili_request_body)

    r = requests.post(url, data=data, headers=headers)

    if r.status_code == 200:

        response_text = json.loads(r.text)

        resp = str(response_text['tracepoints'])

        resp = resp.replace("'waypoint_index': None", "'waypoint_index': '#'")
        resp = resp.replace("None", "{'matchings_index': '#', 'name': '', 'waypoint_index': '#', 'alternatives_count': 0, 'distance': 0, 'location': [0.0, 0.0]}")
        data = ast.literal_eval(resp)

        fixed = json.dumps(data)

        df_response = pd.read_json(StringIO(fixed))
        df_response = df_response[['name', 'distance', 'location']]

        df_trip_optimized = pd.merge(df, df_response, left_index=True, right_index=True)


        df_trip_optimized = df_trip_optimized[
            df_trip_optimized['location'].apply(lambda loc: loc != [0.0, 0.0])
        ].reset_index(drop=True)

        line_opt = LineString(df_trip_optimized['location'].tolist())
        gdf_line_opt = gpd.GeoDataFrame(geometry=[line_opt], crs="EPSG:4326")

        gdf_line_opt.plot(ax=ax, color='blue', linewidth=1.2, alpha=0.35)
        return gdf_line_opt

def main(download_activities=False):

    if(download_activities == True):

        os.makedirs(SAVE_DIR, exist_ok=True)
        token = get_access_token()
        activities = get_all_activities(token)
        print(f"Found {len(activities)} activities.")

        for act in tqdm(activities, desc="Getting activities"):
            act_id = act["id"]
            print(f"Activity ID: {act_id}")

            streams = get_streams(token, act_id)
            df = stream_to_df(streams)

            df.to_pickle(os.path.join(SAVE_DIR, f"{act_id}.pkl"))


    fig, ax = plt.subplots(figsize=(6, 6))
    fig.patch.set_facecolor("black")
    ax.set_facecolor("black")

    plt.axis('equal')
    plt.tight_layout()
    plt.axis('off')

    files = os.listdir(SAVE_DIR)
    gdfs = []
    for file in tqdm(files, desc="Processing activities"):
        if file.endswith(".pkl"):
            df = pd.read_pickle(os.path.join(SAVE_DIR, file))
            route_gdfs = plot_route(df, ax)
            gdfs.append(route_gdfs)

    full_gdf = gpd.GeoDataFrame(pd.concat(gdfs, ignore_index=True), crs="EPSG:4326")
    minx, miny, maxx, maxy = full_gdf.total_bounds

    delta = (maxx - minx) * 0.05

    ax.set_xlim(minx-delta, maxx+delta)
    ax.set_ylim(miny-delta, maxy+delta)

    ax.set_aspect('equal', adjustable='datalim')

    ctx.add_basemap(ax, crs="EPSG:4326", source=ctx.providers.CartoDB.DarkMatterNoLabels)
    ax.axis('off')
    for spine in ax.spines.values():
        spine.set_visible(False)
    ax.set_xticks([])
    ax.set_yticks([])x

    plt.savefig("map.png", dpi=300, bbox_inches='tight', pad_inches=0)
    plt.close()


if __name__ == "__main__":
main(True)- I removed the axes and spacing; it’s a bit tricky in matplotlib
- I used a dark mode base map because I like dark mode
