Projects
Some of my personal projects:
d3-raster-tools-docs
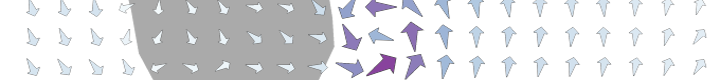
Drawing raster data using d3js is quite undocummented. This small documentation explains how to work with raster data and the d3js to create dynamic data visualizations.
Includes isolines, isobands, direct raster values drawing and streamlines, barbs and vector images from vectorial fields.
d3-composite-projections

Set of d3 projections for showing countries’ distant lands together.
Drawing choropleth maps is difficult in some countries when parts of them are far away from the mainland. This set of projections work like the original AlbersUSA projection, putting all the regions together.
Basemap tutorial

Basemap is a great tool for creating maps using python in a simple way. It’s a matplotlib extension, so it has got all its features to create data visualizations, and adds the geographical projections and some datasets to be able to plot coast lines, countries, and so on directly from the library.
Basemap has got some documentation, but some things are a bit more difficult to find. I started this documentation to extend a little the original documentation and examples, but it grew a little, and now covers many of the basemap possibilities.
GDAL IRIS driver

VAISALA/SIGMET weather radars have their own format to store the generated products, so opening them can be quite difficult without their software.
This driver, integrated in the default GDAL library, makes possible to open these files from any software using GDAL, including QGIS and the GDAL Python bindings.