Mapping with gpu.js
gpu.js is a JavaScript Acceleration library for GPGPU (General purpose computing on GPUs) in Javascript. This means, basically, using the GPU instead of the CPU for the calculations, and coding in simple JavaScript.
The library is awesome, but I found some issues trying to run my things, so I will try to put all my steps here, which will help me in first place.
Including the library
From a regular web page, just include:
<script src="/path/to/js/gpu.min.js"></script>then, initialize the library calling
const gpu = new GPU();It’s possible to pass to the GPU constructor the options:
{mode: 'gpu'} or {mode: 'cpu'}Setting it forces the use of the CPU, which can be nice for performance comparison.
Using node, just install it with:
npm install gpu.jsAnd require the module with:
const gpujs = require("gpu.js");
const gpu = new gpujs();
ObservableHQ
ObservableHQ is a new and awesome site to publish interactive examples. Requiring libraries is possible, but they have to be in UMD or AMD, which is not the case of gpu.js. A working solution is using the wzrd service
GPU = require("https://wzrd.in/standalone/gpu.js");First working example
Let’s see the simplest calculation using node:
var GPU = require("gpu.js");
var gpu = new GPU();

var gpuKernel = gpu
  .createKernel(function () {
    return this.thread.x + this.thread.y;
  })
  .setOutput([2, 2]);

console.info(gpuKernel());- After initializing the class, a kernel is created with createKernel
- The function that calculates every point is passed as the parameter This function has the this.thread.x, this.thread.y and this.thread.z variables that return the position in the matrix to calculate
- In the setOutput method, the size of the matrix is set
- Just call the created kernel to calculate the values
Some more things about this functions:
-
They can take array arguments
function(points){…}
and call it
gpuKernel([1,2,3])
- The size of the matrix is not accessible, unless a constant is declared
var gpuKernel = gpu.createKernel(function() {
for(let i = 0; i <this.constants.xSize; i++){
....
}
return (this.thread.x + this.thread.y);
}).setOutput([2,2])
.setConstants({xSize:2, ySize: 2});
- The JavaScript operators that can be called inside the kernel functions are quite limited. Here’s the list. Also, no console.log and many other functions can go there.
Drawing directly on a Canvas
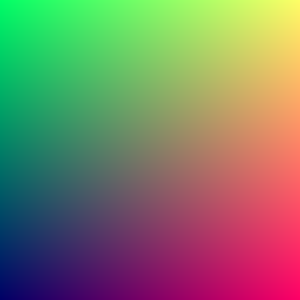
One of the points that make gnu.js really interesting is that the gpu function can draw directly on a Canvas element, which is what we need when mapping. Here’s a simple example, to run directly on the browser:
<!DOCTYPE html>
<meta charset="utf-8">
<body>
    <script src="gpu.min.js"></script>
<script>
const gpu = new GPU();
const render = gpu.createKernel(function() {
    this.color(this.thread.x/500, this.thread.y/500, 0.4, 1);
})
  .setOutput([500, 500])
  .setGraphical(true);

render();
const canvas = render.getCanvas();
document.getElementsByTagName('body')[0].appendChild(canvas);

</script>- The method setGraphical(true) has to be called to make the kernel draw on a Canvas. The setOutput method will set now the Canvas size
- Later, get the Canvas with getCanvas()
- Inside the function, set the this.color field with four values (rgba) from 0 to 1
- The y axis goes bottom to top! This is the opposite of the usual notation
It’s easy! The result looks like this:
Some algorithms
Inverse of the distance
In one of the first posts of this blog I made a python script for drawing a grid from a set of scattered points. Using gpu.js this can be done at real-time and see the results when changing the parameters, as in this ObservableHQ notebook
The function to calculate the values is:
invDist = function(xpos, ypos, values, smoothing, colorScale) {
var nominator=0;
var denominator=0;
var flagDist = -1;
for (var i = 0; i < this.constants.numPoints; i++) {
var dist = Math.sqrt((this.thread.x-xpos[i])_(this.thread.x-xpos[i])+
(this.thread.y-ypos[i])_(this.thread.y-ypos[i]) + smoothing\*smoothing);
nominator=nominator+(values[i]/dist)
denominator=denominator+(1/dist)
if(dist < 0.1){
flagDist = i;
}

    }
    var value;
    if(flagDist >= 0){
        value = values[flagDist];
    } else {
        value = nominator/denominator;
    }

    var c = Math.ceil(255 * value);
    this.color(colorScale[c*4]/255, colorScale[1 + c*4]/255, colorScale[2 + c*4]/255, 1);

}
- We only iterate the points, but not hte pixels, referenced by this.thread.x and this.thread.y, that will be done in parallel
Hillshade
The hillshade algorithm depends on the current pixel and the one around it, so it’s possible to use gpu.js easily:
function hillshade(demData) {
let azimuthrad = this.constants.azimuth _ 0.017453292519943295;
let altituderad = this.constants.angleAltitude _ 0.017453292519943295;

let gradX, gradY;

let yPos = this.constants.ySize - this.thread.y;

if(this.thread.x==0) gradX = demData[yPos][this.thread.x+1] - demData[yPos][this.thread.x];
else if(this.thread.x==this.constants.xSize-1) gradX = demData[yPos][this.thread.x] - demData[this.thread.y][this.thread.x-1];
else gradX = (demData[yPos][this.thread.x+1] - demData[yPos][this.thread.x])/2 + (demData[yPos][this.thread.x] - demData[yPos][this.thread.x-1])/2;

if(yPos==0) gradY = demData[yPos+1][this.thread.x] - demData[yPos][this.thread.x];
else if(yPos==this.constants.ySize-1) gradY = demData[yPos][this.thread.x] - demData[yPos-1][this.thread.x];
else gradY = (demData[yPos+1][this.thread.x] - demData[yPos][this.thread.x])/2 + (demData[yPos][this.thread.x] - demData[yPos-1][this.thread.x])/2;

let slope = 3.141593/2 - Math.atan(Math.sqrt(gradX*gradX + gradY*gradY));
let aspect = Math.atan(-gradY, gradX); //should be atan2, but not working!

let hs*value = Math.sin(altituderad) * Math.sin(slope) + Math.cos(altituderad) \_ Math.cos(slope) \* Math.cos(azimuthrad - aspect);

this.color(hs_value, hs_value, hs_value, 0.1);

}- If you compare it with the original hillshade example, the main difference is that no for loops have to be used to calculate all the pixel values. Instead, the this.thread.x and this.thread.y variables are used, and all the points will be done at once.
- Note that Math.atan is used instead of Math.atan2. This is because the GSLS functions have to be used instead of the ones in JavaScript. All the available functions are referenced in their docs
Using it with Leaflet
Until now, the examples don’t show an easy way to put a map on the result. A nice option is using Leaflet. Since gpu.js returns a canvas element and Leaflet has the possibility to show it, merging both is not difficult. I’m using a small class called canvasOverlay.
As you can see in this observable, the function to call from the canvasOverlay would be like:
drawCanvas = function(canvasOverlay, params) {

let canvas = params.canvas;
let context = canvas.getContext('2d');
context.globalAlpha = 0.5;

let gl = params.canvas.getContext('webgl2', {premultipliedAlpha: false});
let gpu = new GPU({
canvas,
webGl: gl
});
let krender = gpu.createKernel(function(xpos, ypos, values, colorScale) {

    var nominator=0;
    var denominator=0;
    var flagDist = -1;

    for (var i = 0; i < this.constants.numPoints; i++) {

        var dist = Math.sqrt((this.thread.x-xpos[i])*(this.thread.x-xpos[i])+
            (this.thread.y-ypos[i])*(this.thread.y-ypos[i]) + 2);
            nominator=nominator+(values[i]/dist)
            denominator=denominator+(1/dist)
            if(dist < 0.1){
                flagDist = i;
            }

    }
    var value;
    if(flagDist >= 0){
        value = values[flagDist];
    } else {
        value = nominator/denominator;
    }

    var c = Math.ceil(255 * value);
    this.color(colorScale[c*4]/255, colorScale[1 + c*4]/255, colorScale[2 + c*4]/255, 1);

})
.setConstants({ numPoints: points.length })
.setDebug(true)
.setOutput([canvas.width, canvas.height])
.setGraphical(true);

let xPos = [];
let yPos = [];
let values = [];

points.forEach(function(d){
values.push(d.value);
let coords = canvasOverlay.\_map.latLngToContainerPoint(
L.latLng(d.lat, d.lon));
xPos.push(coords.x);
yPos.push(coords.y);
});

krender(xPos, yPos, values, csImageData);
let result = krender.getCanvas();
context.drawImage(result, 0, 0);
}
- Get the gpujs canvas with getCanvas()
- Draw in in the leaflet canvas with context.drawImage(result, 0, 0)
Links
- The gpu.js web site
- GPGPU Wikipedia page
- ObservableHQ
- wzrd.in
- generateMatrices source
- List of gpu.js supported math functions
- Creating a grid from scattered data using inverse of the distance with python (gdal_grid approach)
- canvasOverlay
- GSLS functions reference
ObservableHQ notebooks
- Most basic gpu.js example
- Most basic gpu.js example with performance test
- Basic gpu.js canvas example
- Inverse of the distance with gpu.js
- Shaded relief with gpu.js and d3.js
- Shaded relief with gpu.js drawing the canvas directly
- Shaded relief without gpu.js
- Leaflet + inverse of the distance
Blocks with some of the examples