d3-raster-tools-docs
I’ve written a [short tutorial]({{ site.baseurl }}/d3-raster-tools-docs) explaining how to work with raster data and d3js to create dynamic data visualizations.
Usually, the examples show how to place points or polygons on a map. Those examples are working with vectorial data. But many datasets are rasters, so the lack of examples and libraries made difficult to use d3js with meteorological data, DEM data, etc.
Some common representations could be easily done with existing libraries, others didn’t have available tools. This tutorial will show how to use:
- geotiff: Reading the GeoTIFF data (not the projectiopn, which would be cool)
- raster-streamlines: Drawing streamlines from vectorial fields
- raster-marching-squares: Creating the isobands with the wind speed
- reproject: Reprojecting the generated GeoJSON
- proj4js: Reprojecting points
And examples for all the common raster visualizations covered by the Basemap library. All the examples have the Canvas and the SVG version so it’s easy to use the most convenient.
[The tuorial can be found here.]({{ site.baseurl }}/d3-raster-tools-docs)
I will add more examples in the future, if I find that some cases were not covered.
Some of the examples are listed below:
|----------|:-------------:|
|[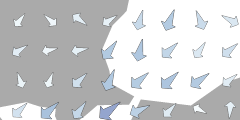 Wind arrows]({{ site.baseurl }}/d3-raster-tools-docs/code_samples/wind-arrows-page.html) | [
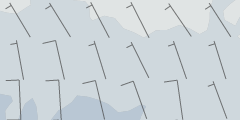
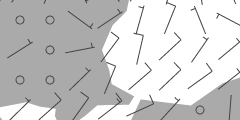 Wind barbs]({{ site.baseurl }}/d3-raster-tools-docs/code_samples/wind-barbs-page.html) |
|[
Wind barbs]({{ site.baseurl }}/d3-raster-tools-docs/code_samples/wind-barbs-page.html) |
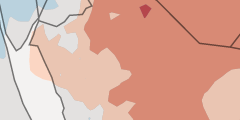
|[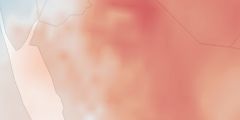 Raster interpolation]({{ site.baseurl }}/d3-raster-tools-docs/code_samples/raster-interpolation-page.html) | [
![]() Raster original pixels]({{ site.baseurl }}/d3-raster-tools-docs/code_samples/raster-pixels-page.html) |
|[
Raster original pixels]({{ site.baseurl }}/d3-raster-tools-docs/code_samples/raster-pixels-page.html) |
|[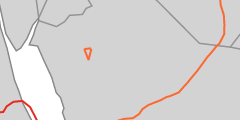 Isolines]({{ site.baseurl }}/d3-raster-tools-docs/code_samples/isolines-page.html) | [
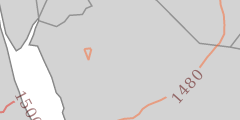 Isolines with labels]({{ site.baseurl }}/d3-raster-tools-docs/code_samples/isolines-labels-page.html) |
|[
Isolines with labels]({{ site.baseurl }}/d3-raster-tools-docs/code_samples/isolines-labels-page.html) |
|[ Isobands]({{ site.baseurl }}/d3-raster-tools-docs/code_samples/isobands-page.html) | [
 Streamlines]({{ site.baseurl }}/d3-raster-tools-docs/code_samples/streamlines-page.html) |
|[
Streamlines]({{ site.baseurl }}/d3-raster-tools-docs/code_samples/streamlines-page.html) |
|[ Projected GeoTIFF]({{ site.baseurl }}/d3-raster-tools-docs/code_samples/wind-barbs-projected-page.html) | [
 Projected raster interpolation]({{ site.baseurl }}/d3-raster-tools-docs/code_samples/raster-interpolation-projected-page.html) |