Last year I created the first version of the d3-composite-projections library, but some things have changed since then, so a major update has been released. This update includes:
- New projections have been added
- D3js v4 is used instead of v3. All the code has been re-written using ES2015
Projections
The available projections for this 1.0.1 version are:
- USA: geoAlbersUSA
- USA Territories: geoAlbersUsaTerritories as albersUsa, but adding the American Samoa, Puerto Rico, U.S. Virgin Islands, Guam and Northern Marianas Islands, so all the Congressional Districts are represented
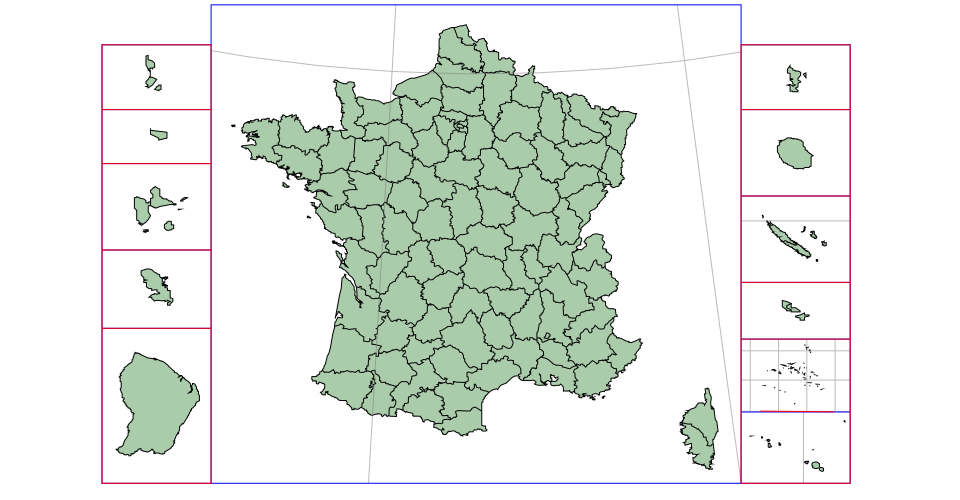
- France: geoConicConformalFrance
- Portugal: geoConicConformalPortugal
- Spain: geoConicConformalSpain
- Europe: geoConicConformalEurope (thought for Eurostat data)
- Japan: geoConicEquidistantJapan
- Ecuador: geoMercatorEcuador
- Chile: geoTransverseMercatorChile, including the Chilean Antarctic Territory
If you want other countries, I’ll be glad to add them. Sometimes it’s hard to imagine the real uses for this when it’s not a country you know well.
New code style
When Mike Bostock released the d3-geo package I used it as the template, so all the tests and code are written using the same style.
Now, d3-composite-projections can be used with Canvas and SVG, from nodejs, nodejs+browserify, directly from a JavaScript file, etc. Let’s see an example for each case:
SVG + JavaScript file
The most common case to see. This example showing the Congressional Representatives uses it and is similar to this Chilean map using the old version. The code:
<!DOCTYPE html>
<meta charset="utf-8">
<style>
#tooltip {
  position: absolute;
  top: 0;
  left: 0;
  z-index: 10;
  margin: 0;
  padding: 10px;
  width: 200px;
  height: 70px;
  color: white;
  font-family: sans-serif;
  font-size: 0.9em;
  font-weight: bold;
  text-align: center;
  background-color: rgba(0, 0, 0, 0.55);
  opacity: 0;
  pointer-events: none;
  border-radius:5px;
  transition: .2s;
}
</style>
<body>
  <div id="container"/>
  <div id="tooltip"/>
<script src="https://d3js.org/d3.v4.min.js"></script>
<script src="http://d3js.org/topojson.v1.min.js"></script>
<script src="https://cdnjs.cloudflare.com/ajax/libs/d3-composite-projections/1.0.1/d3-composite-projections.min.js"></script>
<script>
var width = 960,
    height = 500;

var projection = d3.geoAlbersUsaTerritories();
var path = d3.geoPath()
.projection(projection);

var svg = d3.select("#container").append("svg")
.attr("width", width)
.attr("height", height);

    var t = d3.transition();

d3.json("us_congressional_districts.json", function(error, us) {
var us = topojson.feature(us, us.objects.us_congressional_districts);
svg.selectAll(".region")
.data(us.features)
.enter()
.append("path")
.attr("class", "region")
.attr("d", path)
.style("fill", function(d){
if(d.properties.PARTY_AFF=="Democrat")
return "#4a86e8";
else
return "#e84a4a";})
.style("stroke", "#000")
.style("stroke-width", "0.5px")
.on("mouseover", function(d){
//Show the tooltip
var x = d3.event.pageX;
var y = d3.event.pageY - 40;

        d3.select("#tooltip")
          .style("left", x + "px")
          .style("top", y + "px")
          .style("opacity", 1)
          .html( d.properties.STATE + " dist: " + d.properties.CONG_DIST + "<br/>" +d.properties.CONG_REP + "<br/>" + d.properties.PARTY_AFF );
        })
        .on("mouseout", function(){
          //Hide the tooltip
          d3.select("#tooltip")
            .style("opacity", 0);
        });;

svg
.append("path")
.style("fill","none")
.style("stroke","#000")
.style("stroke-dasharray","5,5")
.attr("d", projection.getCompositionBorders());

});

</script>- The new D3js v4 can be included from this address: https://d3js.org/d3.v4.min.js
- The d3-composite-projections is uploaded at the cdnjs project
- An other option is including the D3js v4 modules needed, one by one, as in this example. It’s really difficult to manage, it may be better using nodejs and rollup, as in the next point
- Note some changes from a usual version 3 script:
- Adding the geo as a prefix to many functions: path becomes geoPath
- The transitions have changed a little. a transition is declared before appending it to the events
SVG + rollup + JavaScript file
D3js v4 and d3-composite-projections are build using ES2015. Using rollup.js instead of including all the d3js coded, including the non used functions, lets you use ES2015 and uses only the needed modules, so the resulting JavaScript file is much smaller (80% less in this case!). I took the information from this post by Richa Vyas.
The code can be found in this gist.
Basically, the involved files are:
- package.json, which makes possible to install all the dependencies with npm install and sets the build script
- d3.js, which is the entry point for rollup. It takes the needed dependencies and sets the names that the final script must use
- Note that the used functions must be selected from each module i.e. json from the request module
- index.html is a regular file with its html and JavaScript code, but with some things changed because of the names used in the d3.js file
- rollup has set the d3 prefix so all the functions are available wsing d3. as with the old v3 version
- topojson is included so, this time, it must be accessed with the d3 prefix too. Another option would be not to include into the d3.js file
The first time may be a bit tricky, but the final small size it’s worth the effort.
SVG + browserify
All the examples linked to the projections are done this way. Create an html file:
<!DOCTYPE html>
<meta charset="utf-8">

<body>
  <div id="map"></div>

  <script src="bundle.js"></script>
And then, the node file (I called it draw.js):
var d3_composite = require("d3-composite-projections");
var d3_geo = require("d3-geo");
var d3_request = require("d3-request");
var d3_selection = require("d3-selection");
var d3_transition = require("d3-transition");
var topojson = require("topojson");

var width = 960;
var height = 500;

var projection = d3_composite.geoConicConformalEurope();

var path = d3_geo.geoPath().projection(projection);

var svg = d3_selection
  .select("map")
  .append("svg")
  .attr("width", width)
  .attr("height", height);

var t = d3_transition.transition().on("interrupt", function (d, i) {
  console.info(i);
});

d3_request.json("nuts0.json", function (error, topojsonData) {
  var us = topojson.feature(topojsonData, topojsonData.objects.nuts0);

  svg
    .selectAll(".region")
    .data(us.features)
    .enter()
    .append("path")
    .attr("d", path)
    .attr("class", "region")
    .style("fill", "#aca")
    .style("stroke", "#000")
    .style("stroke-width", "0.5px")
    .on("mouseover", function (d, i) {
      d3_selection.select(this).transition(t).style("fill", "red");
    })
    .on("mouseout", function (d, i) {
      d3_selection.select(this).interrupt();
      d3_selection.select(this).transition(t).style("fill", "#aca");
    });

  svg
    .append("path")
    .style("fill", "none")
    .style("stroke", "#f00")
    .attr("d", projection.getCompositionBorders());
});
To create the bundle.js file with browserify, run:
browserify draw.js > bundle.jsOr, if you want a smaller file:
browserify draw.js| uglifyjs > bundle.jsOf course, you will have to install all the dependencies, browserify and uglify first:
npm install d3-composite-projections d3-geo d3-request d3-selection d3-transition topojsonCanvas with Nodejs
If you want to draw png maps from the command line, you can adapt the test scripts included in the library:
var width = 960,
  height = 500,
  projectionName = process.argv[2],
  topojsonName = process.argv[3],
  layerName = process.argv[4],
  projectionSymbol =
    "geo" + projectionName[0].toUpperCase() + projectionName.slice(1);

if (!/^[a-z0-9]+$/i.test(projectionName)) {
  throw new Error();
}

var fs = require("fs"),
  topojson = require("topojson"),
  Canvas = require("canvas"),
  d3_geo = require("d3-geo"),
  d3_composite = require("d3-composite-projections");

var canvas = new Canvas(width, height),
  context = canvas.getContext("2d");

var data = JSON.parse(fs.readFileSync(topojsonName, "utf8")),
  graticule = d3_geo.geoGraticule(),
  outline = { type: "Sphere" };

var path = d3_geo
  .geoPath()
  .projection(d3_composite[projectionSymbol]().precision(0.1))
  .context(context);

context.fillStyle = "#fff";
context.fillRect(0, 0, width, height);
context.save();

context.beginPath();
path(topojson.feature(data, data.objects[layerName]));
context.fillStyle = "#aca";
context.strokeStyle = "#000";
context.fill();
context.stroke();

context.beginPath();
path(graticule());
context.strokeStyle = "rgba(119,119,119,0.5)";
context.stroke();

context.restore();

context.beginPath();
path(outline);
context.strokeStyle = "#00F";
context.stroke();

context.beginPath();
context.strokeStyle = "#F00";
d3_composite[projectionSymbol]().drawCompositionBorders(context);
context.stroke();

canvas.pngStream().pipe(fs.createWriteStream("./" + projectionName + ".png"));- The script takes three arguments:
- The projection name i.e. conicConformalPortugal
- The topojson name i.e. world-50m.json
- The layer name i.e. world
- Note that the method drawCompositionBorders has to be used instead of getCompositionBorders, since getCompositionBorders returns a string as needed in SVG, which it’s impossible to draw using Canvas with node, since the object Canvas2D is not always available.
Install the dependencies with:
npm install topojson canvas d3-geo d3-composite-projectionsand run it like:
node test.js conicConformalSpain provincias.json provincias d3-geo