Mapping EUROSTAT data with D3js: Creating the TopoJSON

click to see the original map by EUROSTAT
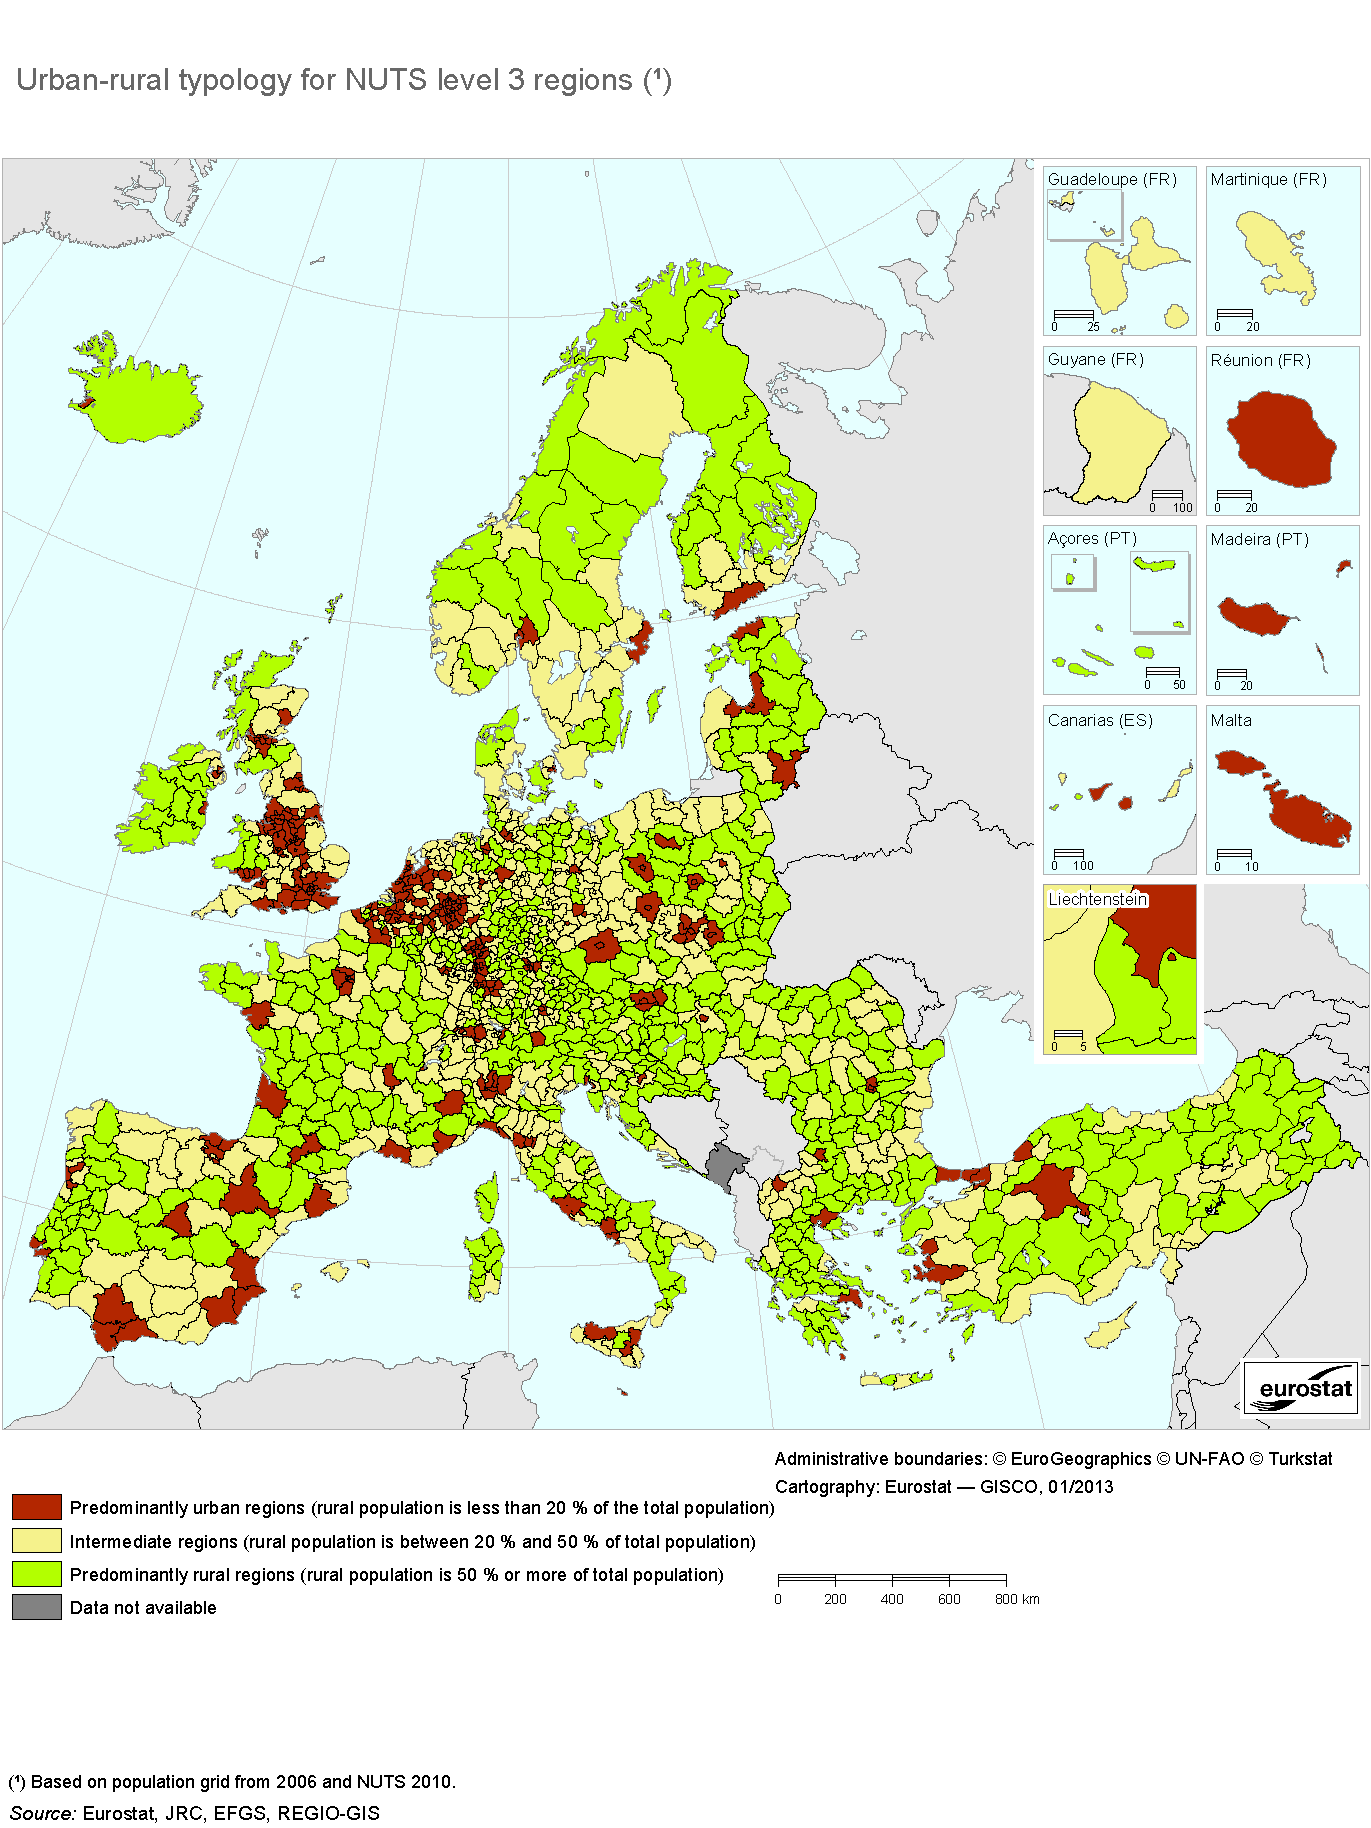
Creating NUTS regions file
Download the NUTS regions in shp format
It’s interesting to have the population associated to each region, so the absolute number of some statistics can be changed to density (number of crimes to crimes/100000 people, for instance). The population data can be downloaded from this url:
Select the population columns Format->numerical format->number 11.000.638 —> 11000638 Save as csv Remove headers and appended data
The header will be:
GEO,GEO(L)/TIME,2010,2011,2012,2013,2014And I changed it to
id,name,pop2010,pop2011,pop2012,pop2013,pop2014The reason is that the topojson program failed to take numeric column names (2013, in our case), and the complex GEO(L)/TIME.
To separate the data into different files for each NUTS level, so the file to load from the browser is smaller:
ogr2ogr -where "STAT_LEVL_=1" nuts1.shp NUTS_RG_01M_2013.shpFor level 1. To get all the levels, levels 0,1,2,3 must be generated.
To create the final topoJSON for nuts level 1, type:
topojson -e demo_r_pjanaggr3.csv --id-property NUTS_ID,id -p nuts_id=NUTS_ID,name,population=+pop2013 -o nuts1.json -- nuts1.shpUsing the generated files
If yo don’t want to create the same topojson, you can just get them from this GIST, with the names nuts0.json, nuts1.json, etc.
Here, you can see a working example too, that gives this result: