Creating maps using D3js and nodejs
Can D3js be used as a script to create SVG or PNG files? There are many examples out there for creating aweseome maps made with D3, but made to be run with the browser. It would be great to make scripts to create the same files to include them in reports, or to edit them using Inkscape, as Kartograph used to do.
I started looking how to do this when testing d3-composite-projections, so I could create a map to check if the library was working ok without opening the browser.
Installation
As usual, the code can be found at GitHub.
To run the examples, you need the package.json file copied in the working dir and execute:
npm installThere is an external dependency to be able to create the Canvas examples: the Cairo library. Here you can find how to install it in different platforms.
About a moth ago, the library jsdom didn’t work with the last version in nodejs, but now this seems to be solved. If you get the error message, just fix the problem by changing the line in package.json to:
"jsdom": "<=3.1.2"Canvas
The easiest way to explore the use of d3 and nodejs is creating PNG files using the node-canvas library.
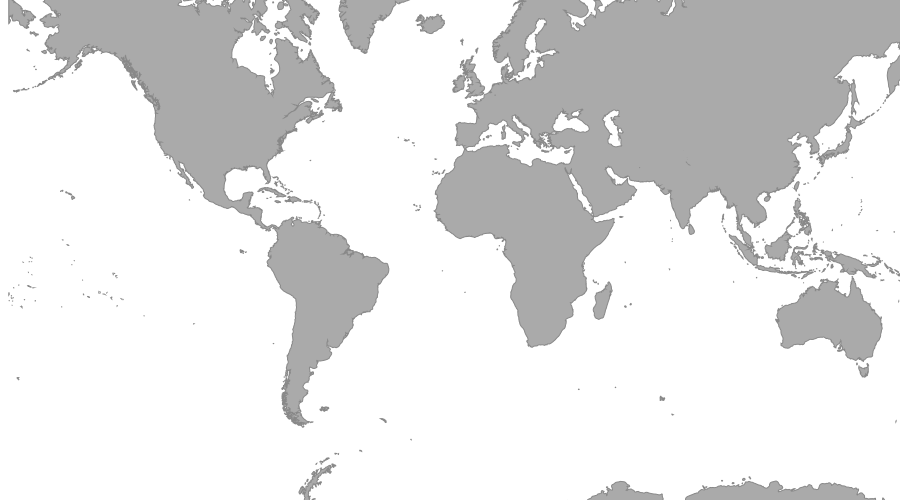
The script for generating the PNG above:
var fs = require('fs');
var Canvas = require('canvas');
var d3 = require('d3');
var topojson = require('topojson');

var width = 900,
height = 500;

var Image = Canvas.Image
, canvas = new Canvas(width, height)
, context = canvas.getContext('2d');

var projection = d3.geo.mercator();
var path = d3.geo.path()
.projection(projection);

var data = JSON.parse(fs.readFileSync(\_\_dirname +"/world-50m.json", 'utf8'));
var land = topojson.feature(data, data.objects.land);

context.strokeStyle = '#888';
context.fillStyle = '#aaa';

context.beginPath();
path.context(context)(land);
context.fill();

context.beginPath();
path.context(context)(land);
context.stroke();

var out = fs.createWriteStream(\_\_dirname + '/test.png');
var stream = canvas.pngStream();
stream.on('data', function(chunk){
out.write(chunk);
});

stream.on('end', function(){
console.log('saved png');
});
The main parts of the script are:
- Requiring the libraries
- Creating the Image, Canvas and context objects with Canvas.Image, new Canvas(width, height) and context = canvas.getContext(‘2d’)
- Creating the map with d3 as usual
- Note how are the JSON files loaded locally, using fs.readFileSync.
- __dirname gives the absolute path to the script, which is mandatory to open the file
SVG
To create an SVG file, a DOM has to be created before. This is done using the jsdom library and it’s a bit more complicated.

The script for generating the SVG above:
var jsdom = require("jsdom");
var fs = require("fs");
var topojson = require("topojson");

jsdom.env({
  html: "<html><body></body></html>",
  scripts: [__dirname + "/node_modules/d3/d3.min.js"],
  done: function (err, window) {
    var width = 900,
      height = 500;

    var projection = window.d3.geo.mercator();
    var path = window.d3.geo.path().projection(projection);

    var svg = window.d3
      .select("body")
      .append("svg")
      .attr("width", width)
      .attr("height", height)
      .attr("xmlns", "http://www.w3.org/2000/svg");

    var data = JSON.parse(
      fs.readFileSync(__dirname + "/world-50m.json", "utf8")
    );

    var land = topojson.feature(data, data.objects["land"]);
    svg
      .datum(land)
      .append("path")
      .attr("class", "land")
      .style("fill", "#aca")
      .style("stroke", "#000")
      .attr("d", path);

    fs.writeFileSync("test.svg", window.d3.select("body").html());
  },
});
There are four parts in this scripts:
- The requires section. All the used libraries are imported, excepting for D3, since D3 must be used as in the browser to be able to detect the DOM.
- jsdom.env is called. This will initialize the DOM so d3 can work as in the browser. I had some problems, solved using this page
- The second argument of the function calls the libraries to include. Is here where d3 is loaded.
- Note the use of __dirname variable to get the absolute path. It did’t work otherwise. Some webs recommend using documentRoot: __dirname, but it didn’t work for me.
- The function after the external JavaScript files are loaded is the regular d3 script, with a pair of differences:
- d3 must be invoked from the window object so it loads properly
- The SVG element must have .attr(“xmlns”, “http://www.w3.org/2000/svg”); so the browser can load the generated file. When creating it dynamically (in a browser), this is not necessary
- The JSON files can be stored locally and read with fs.readFileSync using absolute paths again
- The generated file is written using fs.writeFileSync
Performance
Cool, I can create d3 maps from the command line, but is it fast?
I made a script that makes the 900x500px map for each country in the world-50m topojson (235 files).
- In my computer lasts more or less 30s
- Without drawing the land around the country, the time is 9s
- I made another script that uses an asyncronous approach, but the performace is worse, about 50s in my computer
I haven’t compared it with other libaries such as using Python + PIL with the same data, but the results seem quite good. And you can generate SVGs too!
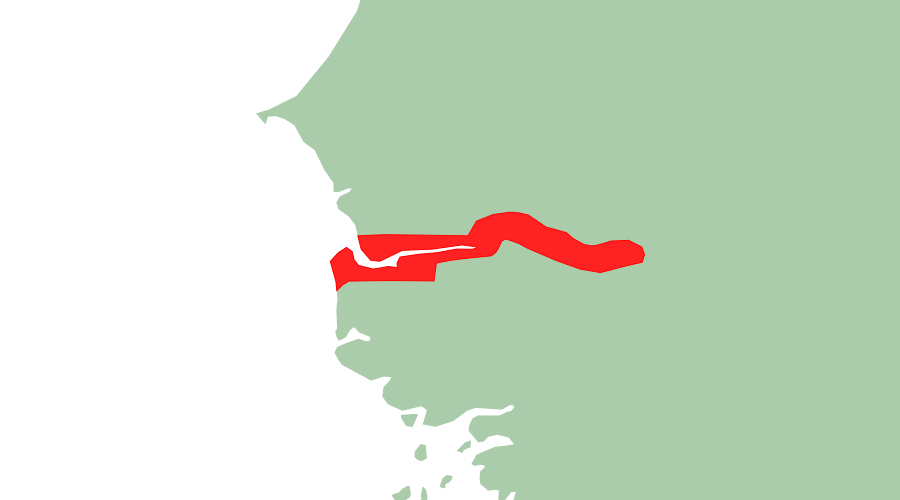
The output file for Gambia
The script:
var fs = require('fs');
var Canvas = require('canvas');
var d3 = require('d3');
var topojson = require('topojson');
var slug = require('slug');

var width = 900,
height = 500;

var data = JSON.parse(fs.readFileSync(**dirname +"/world-50m.json", 'utf8'));
var names = d3.tsv.parse(fs.readFileSync(**dirname +"/world-country-names.tsv", 'utf8'));

var land = topojson.feature(data, data.objects['land']);
var countries = topojson.feature(data, data.objects.countries);

countries = countries.features.filter(function(d) {
return names.some(function(n) {
if (d.id == n.id) return d.name = n.name;
});
}).sort(function(a, b) {
return a.name.localeCompare(b.name);
});

countries.forEach(function(d){
console.info('Generating ' + d.id + ' -> ' + d.name );
var bounds = d3.geo.bounds(d),
dx = bounds[1][0] - bounds[0][0],
dy = bounds[1][1] - bounds[0][1],
x = (bounds[0][0] + bounds[1][0]) / 2,
y = (bounds[0][1] + bounds[1][1]) / 2,
scale = 20 / Math.max(dx / width, dy / height);

var projection = d3.geo.equirectangular()
.center(d3.geo.centroid(d))
.scale(scale);

var Image = Canvas.Image
, canvas = new Canvas(width, height)
, context = canvas.getContext('2d');

var path = d3.geo.path()
.projection(projection);

        context.strokeStyle = '#f00';
        context.fillStyle = '#aca';

        context.beginPath();
        path.context(context)(land);
        context.fill();

        context.fillStyle = '#f22';

        context.beginPath();
        path.context(context)(d);
        context.fill();

        context.beginPath();
        path.context(context)(d);
        context.stroke();

    var out = fs.createWriteStream('/tmp/' + slug(d.name) + '.png');
    var stream = canvas.pngStream();
    stream.on('data', function(chunk){
      out.write(chunk);
    });

    stream.on('end', function(){
      console.log('saved png');
    });

});
Links
- How to initialize jsdom
- node-canvas library
- How to iterate asyncronously
- Mapping with python and PIL