Svelte is a very nice framework for building user interfaces. I wanted to learn more about it, and loved that the d3-like transitions are included and well documented, and much easier than in React, that is my daily library.
So I thought that some cool mapping examples could be done easily and I was right, so here we go!
Don’t want to read all this? Check the examples:
- Example 1: Basic map
- Example 2: Multiple geometries and color scale
- Example 3: Adding transitions
- Example 4: Adding circles
DOM, projections and scales
Svelte controls the DOM (not with a virtual DOM as React or Vue), and has no projection functions for mapping. I wanted to keep all the control into Svelte, so no D3js has been used for this, unlike many of the React with D3 examples out there. Svelte’s Tweened can do this perfectly.
On the other hand, D3 has been splitted long ago into several parts, in a really nice decision. This allows us to take only the parts we want and use them anywhere. The examples will use the projections and scales provided by D3 to calculate the paths.
Installing the examples
The easiest way to start any Svelte project is running:
npx degit sveltejs/template svelte-app
cd svelte-app
npm run dev
This will download the tempate project and run it at the port 5000. All the changes to be done are in the App.svelte file.
So, for all these examples, create a project and start manipulating the App.svelte file with the provided code.
To run all the examples, severall libraries have to be installed too:
npm install topojson, d3-geo, d3-composite-projections, d3-scale, d3-color, d3-interpolateBasic map
This first example creates the easiest map:
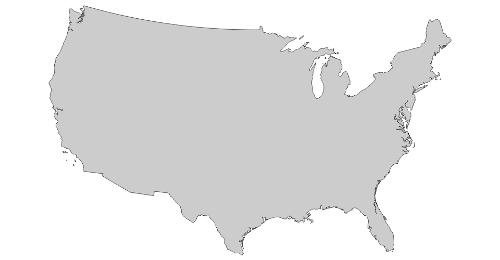
The App.svelte file would be:
<script>
  import { geoAlbers, geoPath } from "d3-geo";
  import { onMount } from "svelte";
  import { feature } from "topojson";
  let data;
  const projection = geoAlbers();
  const path = geoPath().projection(projection);

onMount(async function() {
const response = await fetch(
"https://gist.githubusercontent.com/rveciana/a2a1c21ca1c71cd3ec116cc911e5fce9/raw/79564dfa2c56745ebd62f5655a6cc19d2cffa1ea/us.json"
);
const json = await response.json();
const land = feature(json, json.objects.land);
data = path(land);
});
</script>

<style>
  svg {
    width: 960px;
    height: 500px;
  }
  .border {
    stroke: #444444;
    fill: #cccccc;
  }
</style>

<svg width="960" height="500">
  <path d={data} class="border" />
</svg>- The file is structured in three parts:
- script, where all the JavaScript goes
- style, where the css for the map is set
- The template part, where the HTML elements are defined
- The onMount function is run only once, when the component is mounted. Is here where we will fetch the JSON data we need to draw the map.
- feature is the function from the topojson library to decode the topojson file
- data will have the svg path definition fot the map. Why is declared outside the onMount function? Because it’s used in the template, and since onMount is async, the variable wouldn’t be available when the component is created, giving an error. By doing it this way, the path will be null at the beginning, and the component will re-render when the data is loaded.
- Note that path and projection are taken directly from D3js, but are only pure functions that return the SVG path string given a GeoJSON data. Nothing related to the DOM
- The path is defined to hold the data value as the d attribute
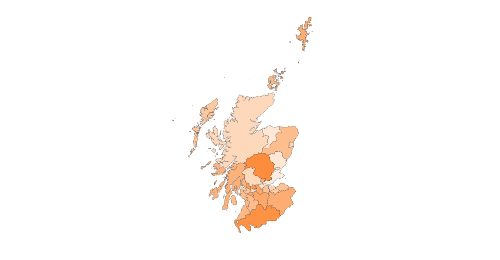
Adding multiple geometries and color scale
Let’s add now more geometries and a color scale to fill them. This example and the next ones are all based on this Observable. Check the result
<script>
  import { geoAlbers, geoPath } from "d3-geo";
  import { scaleLinear } from "d3-scale";
  import { extent } from "d3-array";
  import { onMount } from "svelte";
  import { feature } from "topojson";
  let data = [];
  let colorScale = () => {};
  const width = "960";
  const height = "500";
  const projectionAlbers = geoAlbers()
    .rotate([4.4, 0.8])
    .center([0, 55.4])
    .parallels([50, 60])
    .scale(3800)
    .translate([width / 2, (1.8 * height) / 2]);

  let currentProj = projectionAlbers;
  let path = geoPath().projection(currentProj);

  onMount(async function() {
    const response = await fetch(
      "https://gist.githubusercontent.com/rveciana/27272a581e975835aaa321ddf816d726/raw/c40062a328843322208b8e98c2104dc8f6ad5301/uk-counties.json"
    );
    const json = await response.json();
    const topoData = feature(json, json.objects.UK);
    const land = {
      ...topoData,
      features: topoData.features.filter(
        d => d.properties.NAME_1 === "Scotland"
      )
    };

    const namesExtent = extent(land.features, d => d.properties.NAME_2.length);
    colorScale = scaleLinear()
      .domain(namesExtent)
      .range(["#feedde", "#fd8d3c"]);
    data = land.features;
  });
</script>

<style>
  svg {
    width: 960px;
    height: 500px;
    background-color: "#eeeeee";
  }
  .provinceShape {
    stroke: #444444;
    stroke-width: 0.5;
  }
</style>

<svg width="960" height="500">
  {#each data as feature}
    <path
      d={path(feature)}
      class="provinceShape"
      fill={colorScale(feature.properties.NAME_2.length)} />
  {/each}
</svg>- We are using now another projection (geoAlbers), so the next examples become more interesting
- All the strange stuff with the topojson data is to get only the Scotland counties from the file that contains all the UK counties
- Note the use of scaleLinear to get a color scale. The extent is only the minimum and maximum length of the names of the counties. Just to have some data to plot!
- Now, in the template part, an each block is used to plot a different path for each county. The color is calculated with the color scale
- Note that, again, the color scale and data have to be declared outside the onMount block
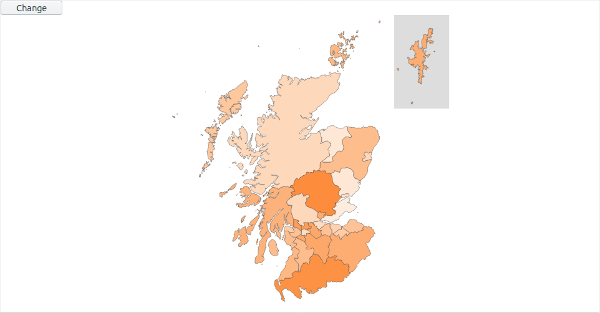
Changing the color when mouse is over
Well, this starts to be interesting. This is where Svelte makes things really easier. We want the same map we had on the previous example but when we hover on a county, we want this county color change a little so the user knows it. This means having behaviours for each path, so we will need nested components. Also, we want to change the projection to a composed one when clicking a button. Check the result
Let’s start with the nested component, called Feature.svelte. Copy this into your project too!
<script>
  import { tweened } from "svelte/motion";
  import { interpolateLab } from "d3-interpolate";
  import { rgb } from "d3-color";
  export let featurePath;
  export let initialColor;

  const color = tweened(initialColor, {
    duration: 300,
    interpolate: interpolateLab
  });
</script>

<style>
  .provinceShape {
    stroke: #444444;
    stroke-width: 0.5;
  }
</style>

<path
d={featurePath}
class="provinceShape"
fill={\$color}
on:mouseover={() => {
color.set(rgb(initialColor).brighter(0.3));
}}
on:mouseout={() => {
color.set(initialColor);
}} />
- The idea, as you can see on the tempalte section, is rendering only the SVG path element. The path itself is given by a prop (note the export on the 4th line)
- The color variable is now a tweened function.
- The first parameter is the initial color, given by a prop calculated the same way as in the previous example, in the parent component
- The interpolation function for a color is not given by Svelte, but a D3 function can be perfectly used. It’s actually what the Svelte docs recommend to do
- The events onmouseover and onmouseout are ones that change this value. Instead of being changed directly, they are changed many times, interpolating the values. These values are read as in a store, so a $ sign has to be used to access the color variable value.
- The rgb.brighter function is used to calculate a new color for each region
Let’s see now the App.svelte file. This will handle the projection transition and the Feature rendering:
<script>
  import { geoAlbers, geoPath, geoProjection } from "d3-geo";
  import { geoAlbersUk } from "d3-composite-projections";
  import { scaleLinear } from "d3-scale";
  import { extent } from "d3-array";
  import { onMount } from "svelte";
  import { feature } from "topojson";
  import { tweened } from "svelte/motion";
  import { interpolate } from "d3-interpolate";
  import Feature from "./Feature.svelte";

  let data = [];
  let colorScale = () => {};
  const width = "960";
  const height = "500";
  const projectionAlbers = geoAlbers()
    .rotate([4.4, 0.8])
    .center([0, 55.4])
    .parallels([50, 60])
    .scale(3800)
    .translate([width / 2, (1.8 * height) / 2]);

  const projectionAlbersUk = geoAlbersUk()
    .translate([width / 2, (1.85 * height) / 2])
    .scale(5200);

  const projectionTween = (projection0, projection1) => {
    return function(t) {
      function project(λ, φ) {
        (λ *= 180 / Math.PI), (φ *= 180 / Math.PI);
        var p0 = projection0([λ, φ]),
          p1 = projection1([λ, φ]);
        if (!p0 || !p1) return [0, 0];
        return [(1 - t) * p0[0] + t * p1[0], (1 - t) * -p0[1] + t * -p1[1]];
      }

      return geoProjection(project)
        .scale(1)
        .translate([0, 0]);
    };
  };

  const currentProj = tweened(projectionAlbers, {
    duration: 1000,
    interpolate: projectionTween
  });

  $: path = geoPath().projection($currentProj);

  const opacity = tweened(0, {
    duration: 1000
  });

  onMount(async function() {
    const response = await fetch(
      "https://gist.githubusercontent.com/rveciana/27272a581e975835aaa321ddf816d726/raw/c40062a328843322208b8e98c2104dc8f6ad5301/uk-counties.json"
    );
    const json = await response.json();
    const topoData = feature(json, json.objects.UK);
    const land = {
      ...topoData,
      features: topoData.features.filter(
        d => d.properties.NAME_1 === "Scotland"
      )
    };

    const namesExtent = extent(land.features, d => d.properties.NAME_2.length);
    colorScale = scaleLinear()
      .domain(namesExtent)
      .range(["#feedde", "#fd8d3c"]);
    data = land.features;
  });
</script>

<style>
  svg {
    width: 960px;
    height: 500px;
    background-color: "#eeeeee";
  }
  .borders {
    fill: #ddd;
  }
</style>

<button
on:click={() => {
currentProj.set($currentProj === projectionAlbers ? projectionAlbersUk : projectionAlbers);
    opacity.set($currentProj === projectionAlbers ? 1 : 0);
}}>
Change
</button>
<svg width="960" height="500">
<path
    class="borders"
    d={projectionAlbersUk.getCompositionBorders()}
    style="opacity: {$opacity}" />
{#each data as feature}
<Feature
      featurePath={path(feature)}
      initialColor={colorScale(feature.properties.NAME_2.length)} />
{/each}

</svg>
- projectionAlbersUk is a composite projection that makes the Shetland islands closer to the mainland. Be careful, this can’t be illegal! ;)
- projectionTween makes the magic. It takes two projections and creates the interpolated projection. The return value is a function of t. t can be a value from 0 to 1. This way, the interpolation can run from 0 to 1, and the path will be recalculated with these intermediate projections. See how is used in the currentProj variable. It’s a cool demonstration that tweened can interpolate anything if you give the proper function to do it
- opacity is another tweened store used to add and remove the rectangle indicator. There is a fade option in Svelte that makes it even easier
- Note that now, instead of adding an SVG path, many Feature components are added so they can handle their behaviour independently. Doing it altogether in the main component is terribly complicated and ugly
Adding circles
The last example is just to show that the usual extra data can be added without any problem.
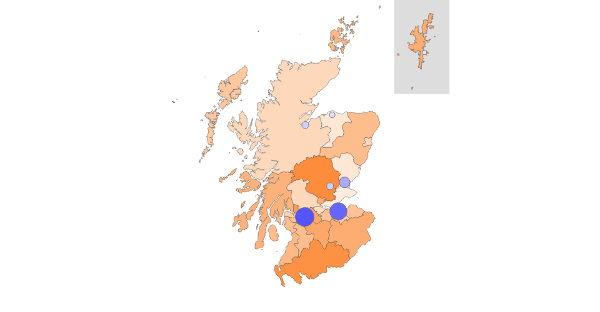
I won’t put all the code, since it’s very similar to the previous one. Check the example here
- cities.js has an array with the locations and the populations. The sizes of the circles are calculated using the d3 scaleSqrt scale, so the area is proportional to the population, not the radius.
- An each block is used to draw each circle as in the second example. Since they have no individual behaviour, no extra components are needed
cities.js:
export const cities = [
{ name: "Perth", lat: 56.396999, lon: -3.437, population: 47180 },
{ name: "Glasgow", lat: 55.860916, lon: -4.251433, population: 598830 },
{ name: "Dundee", lat: 56.462002, lon: -2.9707, population: 148270 },
{ name: "Dundee", lat: 56.462002, lon: -2.9707, population: 148270 },
{ name: "Elgin", lat: 57.653484, lon: -3.335724, population: 23128 },
{ name: "Edinburgh", lat: 55.953251, lon: -3.188267, population: 482005 },
{ name: "Edinburgh", lat: 55.953251, lon: -3.188267, population: 482005 },
{ name: "Inverness", lat: 57.477772, lon: -4.224721, population: 46870 },
{ name: "Lerwick", lat: 60.154167, lon: -1.148611, population: 6958 }
];
Final thoughts
Although I have experience with React, I am really new to Svelte. Besides loving how is done, what impressed me the most is how easy is to make all the traditional D3js visualizations, but with the power of having an organized framework with components, stores, that is really fast and produces small bundles, etc.
I’m sure I’ve made many errors and that the code can be better, but I would spend a lot of hours replicating data visualizations into Svelte if I had time. Give it a try!
Links
- Example 1: Basic map
- Example 2: Multiple geometries and color scale
- Example 3: Adding transitions
- Example 4: Adding circles
- Svelte web site
- Virtual DOM is pure overhead
- Svelte’s Tweened function
- Topojson feature function
- Scotland map Observable example
- The geoAlbers projection
- d3-composite-projections
- Islands (Scotland) Act 2018